wandb.Run.log() API call.
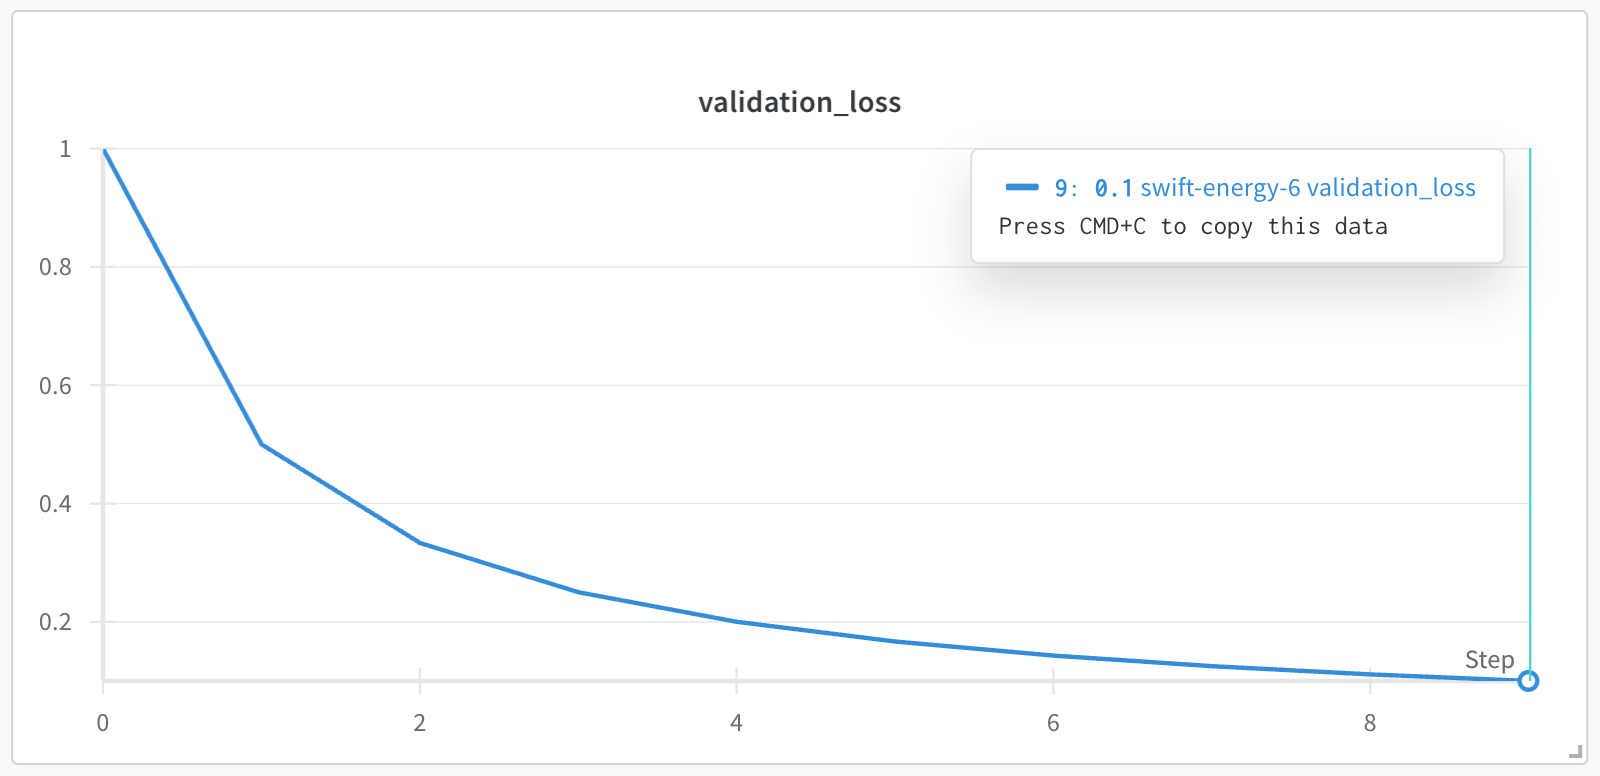
For example, the following script has a for loop that iterates 10 times. In each iteration, the script logs a metric called validation_loss and increments the step number by 1.
validation_loss metric is plotted against the step x-axis, which increments by 1 each time wandb.Run.log() is called. From the previous code, the x-axis shows the step numbers 0, 1, 2, …, 9.
define_metric() method to use any metric you log as a custom x-axis.
Specify the metric that you want to appear as the y-axis with the name parameter. The step_metric parameter specifies the metric you want to use as the x-axis. When you log a custom metric, specify a value for both the x-axis and the y-axis as key-value pairs in a dictionary.
Copy and paste the following code snippet to set a custom x-axis metric. Replace the values within <> with your own values:
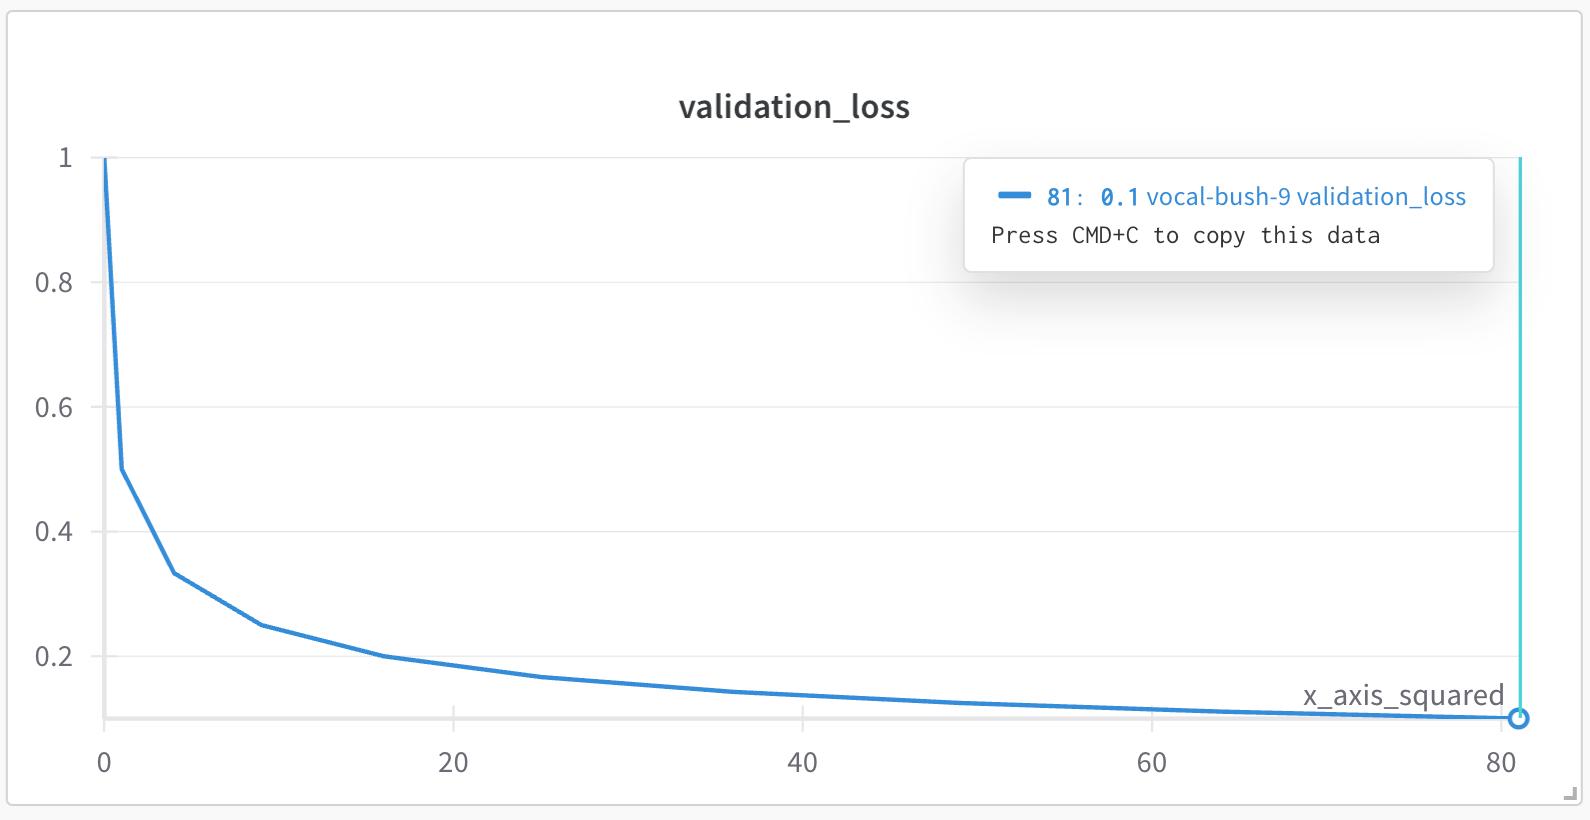
x_axis_squared. The value of the custom x-axis is the square of the for loop index i (i**2). The y-axis consists of mock values for validation loss ("validation_loss") using Python’s built-in random module:
validation_loss metric is plotted against the custom x-axis x_axis_squared, which is the square of the for loop index i. Note that the x-axis values are 0, 1, 4, 9, 16, 25, 36, 49, 64, 81, which correspond to the squares of 0, 1, 2, ..., 9 respectively.
globs with string prefixes. As an example, the following code snippet plots logged metrics with the prefix train/* to the x-axis train/step: