Performance is usually influenced by a combination of:Documentation Index
Fetch the complete documentation index at: https://docs.wandb.ai/llms.txt
Use this file to discover all available pages before exploring further.
- the number of runs in a project
- the number of steps in each run
- the number of distinct metrics you log
- how often you call
wandb.Run.log() - how much data you send in each log call
- how your workspace is configured
Key terms
The following terms are used throughout this page.Steps
A step is a single logical row of metrics in a run. A step is finalized whenwandb.Run.log() is called with commit=True, or implicitly when neither commit nor step is specified.
Metric cardinality
Metric cardinality is the number of distinct metric keys logged in a project, including keys in nested dictionaries. For example, the following logs 4 distinct metric keys:a, b.c, b.d.e, and b.d.f.
Logged points
Logged points are the total number of metric values recorded. For example, both of the following code samples produce three logged points:Log frequency
Log frequency is the number ofwandb.Run.log() calls per minute.
Throughput
Throughput is the total number of logged points recorded per minute. You can think of throughput as:Recommendations at scale
The following table summarizes recommended operating ranges for large-scale logging.| Dimension | Guidance at scale |
|---|---|
| Runs per project | 10,000 |
| Steps per run | 500,000 |
| Metric cardinality per project | 100,000 |
| Log frequency | 1,000 rows per minute |
| Throughput | 100,000 values per minute |
| Video throughput | 40 MB per minute |
These values are guidelines for maintaining good performance at scale. W&B may continue to accept data beyond these recommendations, but pages can become slower to load and use.
Throughput examples
Different logging patterns can produce the same throughput.Scalar logging examples
| Metrics per log call | Log frequency (per minute) | Throughput (values per minute) |
|---|---|---|
| 100 | 1,000 | 100,000 |
| 1,000 | 100 | 100,000 |
| 10,000 | 10 | 100,000 |
| 20,000 | 5 | 100,000 |
Video logging examples
| Video size (MB) | Log frequency (per minute) | Video throughput (MB per minute) |
|---|---|---|
| 1 | 46 | 46 |
| 5 | 8 | 40 |
| 10 | 4 | 40 |
| 50 | 1 | 50 |
| 100 | 0.3 | 30 |
| 250 | 0.1 | 25 |
| 500 | 0.07 | 35 |
Logging considerations
Usewandb.Run.log() to track experiment metrics.
Metric cardinality
Keep the total metric cardinality (number of distinct metrics) in a project within the recommended range for your workload. High metric cardinality is one of the most common causes of slow workspaces. Because W&B flattens nested keys into dot-separated metric names, metric cardinality can increase more than you expect. For example, the following logs 3 distinct metric keys:a, b.c, and b.d.
Value size
Keep the size of a single logged value under 1 MB and the total size of a singlewandb.Run.log() call under 25 MB.
These recommendations do not apply to wandb.Media types such as wandb.Image and wandb.Audio, which are handled differently.
W&B still stores logged data that exceeds these recommendations, but pages may load more slowly.
Log frequency and throughput
Choose a logging frequency that matches the value of the data you are collecting. Logging too often can increase SDK overhead and make the app slower, especially when combined with high metric cardinality or large payloads. As a starting point, keep logging within these guidelines:- Log frequency: less than 1,000
wandb.Run.log()calls per minute - Throughput: less than 100,000 logged values per minute
- Video throughput: less than 40 MB per minute
Config size
Keep the total size of a run config under 10 MB. Large configs can slow project workspaces and runs table operations.Workspace performance
Workspace performance depends on both the underlying project data and workspace configuration.Runs per project
For large projects, keep the number of runs in a project under 10,000 for best performance. If your team regularly works with only a subset of runs, consider moving older or less frequently used runs into a separate archive project. See Manage runs.Panel count
By default, a workspace in automatic mode creates standard panels for each logged key. In large projects, this can produce too many panels and slow the workspace. To improve performance:- Reset the workspace to manual mode.
- Use Quick add to add only the panels you need.
Deleting unused panels one at a time usually has little effect. Reset the workspace and add back only the panels you want.
Section count
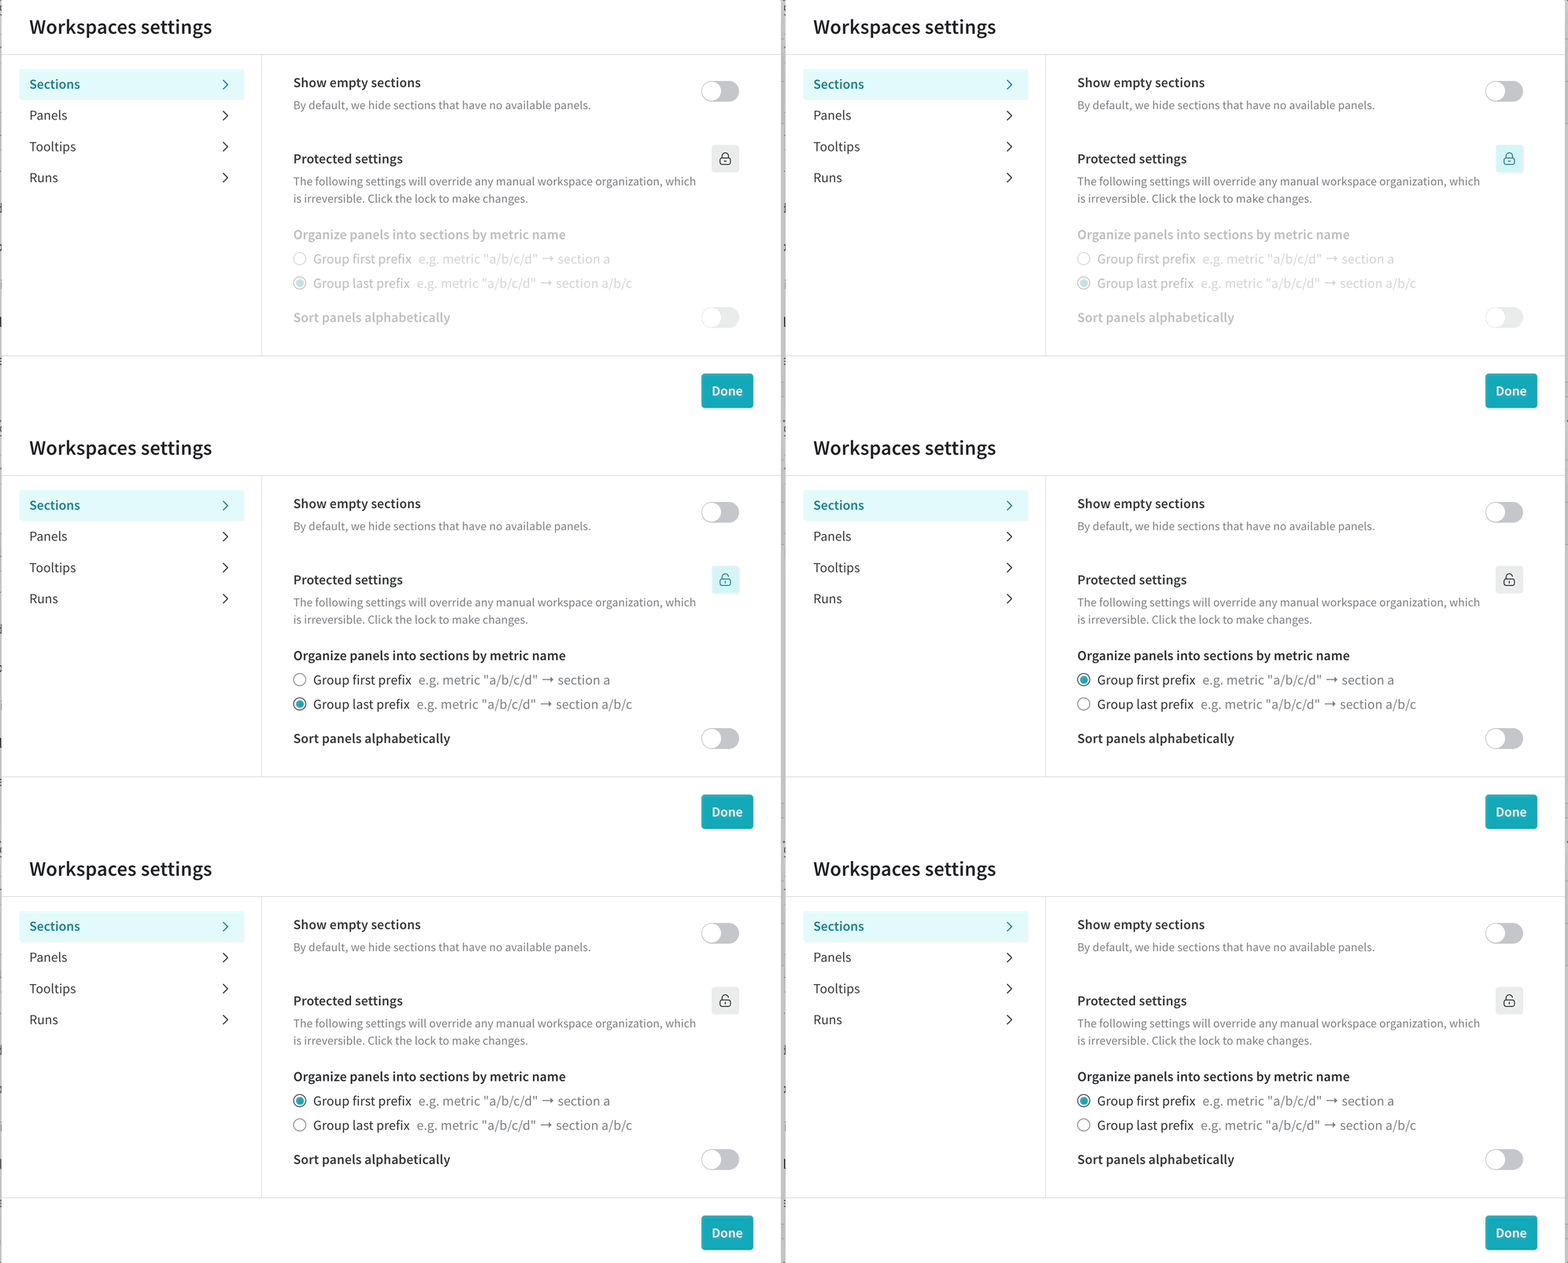
Hundreds of sections in a workspace can hurt performance. Create sections based on high-level metric groupings rather than one section per metric. If you have too many sections, consider creating sections by prefix rather than suffix so that related metrics are grouped into fewer sections.
Many metrics per run
When logging thousands of metrics per run, use a manual workspace so that you can choose which metrics to visualize. A focused set of panels loads faster. Metrics that are not plotted are still collected and stored. To reset a workspace to manual mode, click the workspace’s action () menu, then click Reset workspace. Resetting a workspace has no impact on stored metrics for runs. See workspace panel management.File count
Keep the number of files uploaded for a single run under 1,000. If you need to log a large number of files, use W&B Artifacts instead. Exceeding 1,000 files in a single run can slow run pages.Reports and workspaces
A report is designed for communication and presentation. A workspace is designed for dense, interactive analysis across many runs and metrics. Use a workspace when you need to compare large numbers of runs or view many plots together. Use a report when you want to present curated results.Python script performance
Logging can add overhead to your training script. The main contributors are:- Large payloads
- Network speed and backend configuration
- Very frequent calls to
wandb.Run.log()
wandb.Run.log() too often, each call can add a small amount of latency to the training loop. Batching multiple metrics into fewer log calls usually improves performance.
Is frequent logging slowing your training runs down? See this Colab for strategies to improve performance by adjusting your logging pattern.
Rate limits
W&B Multi-tenant Cloud APIs use rate limits to maintain service reliability and availability.Rate limits are subject to change.
429 Rate limit exceeded and includes rate-limit headers in the response.
Rate-limit HTTP headers
| Header name | Description |
|---|---|
RateLimit-Limit | Quota available in the current time window, scaled from 0 to 1000 |
RateLimit-Remaining | Remaining quota in the current window, scaled from 0 to 1000 |
RateLimit-Reset | Number of seconds until the current quota resets |
Metric logging API rate limits
wandb.Run.log() sends training data to W&B, either directly online or later through offline syncing.
Rate limits for metric logging apply at the project level and include both request rate and total request size over a rolling time window. Paid plans have higher limits than free plans.
If you exceed a rate limit, the W&B SDK automatically retries requests with backoff. In some cases, this can delay run.finish() until the rate-limit window resets.
To reduce the chance of rate limiting:
- Use the latest W&B SDK version.
- Reduce logging frequency.
- Batch related metrics into fewer log calls.
- Use offline logging and sync later when appropriate.
wandb sync <run-file-path>. See wandb sync.
GraphQL API rate limits
The W&B app and the public API use GraphQL requests to query and modify data. For Multi-tenant Cloud:- unauthorized requests are rate-limited per IP address
- authorized requests are rate-limited per user
- some SDK requests that specify a project path can also be limited per project based on database query time
429 Rate limit exceeded or see RateLimit-Remaining=0, wait for the number of seconds in RateLimit-Reset before retrying.
Troubleshooting slow projects
If a project or workspace feels slow, check the following first:- Did recent runs introduce a large number of new metric names?
- Are you logging too frequently?
- Are individual
run.log()calls very large? - Is the workspace in automatic mode with too many panels or sections?
- Does the project contain more runs than your team actively uses?
Browser considerations
The W&B app can be memory-intensive and performs best in Chrome. Depending on your computer’s memory, having W&B active in 3+ tabs at once can cause performance to degrade. If you encounter unexpectedly slow performance, consider closing other tabs or applications.Reporting performance issues to W&B
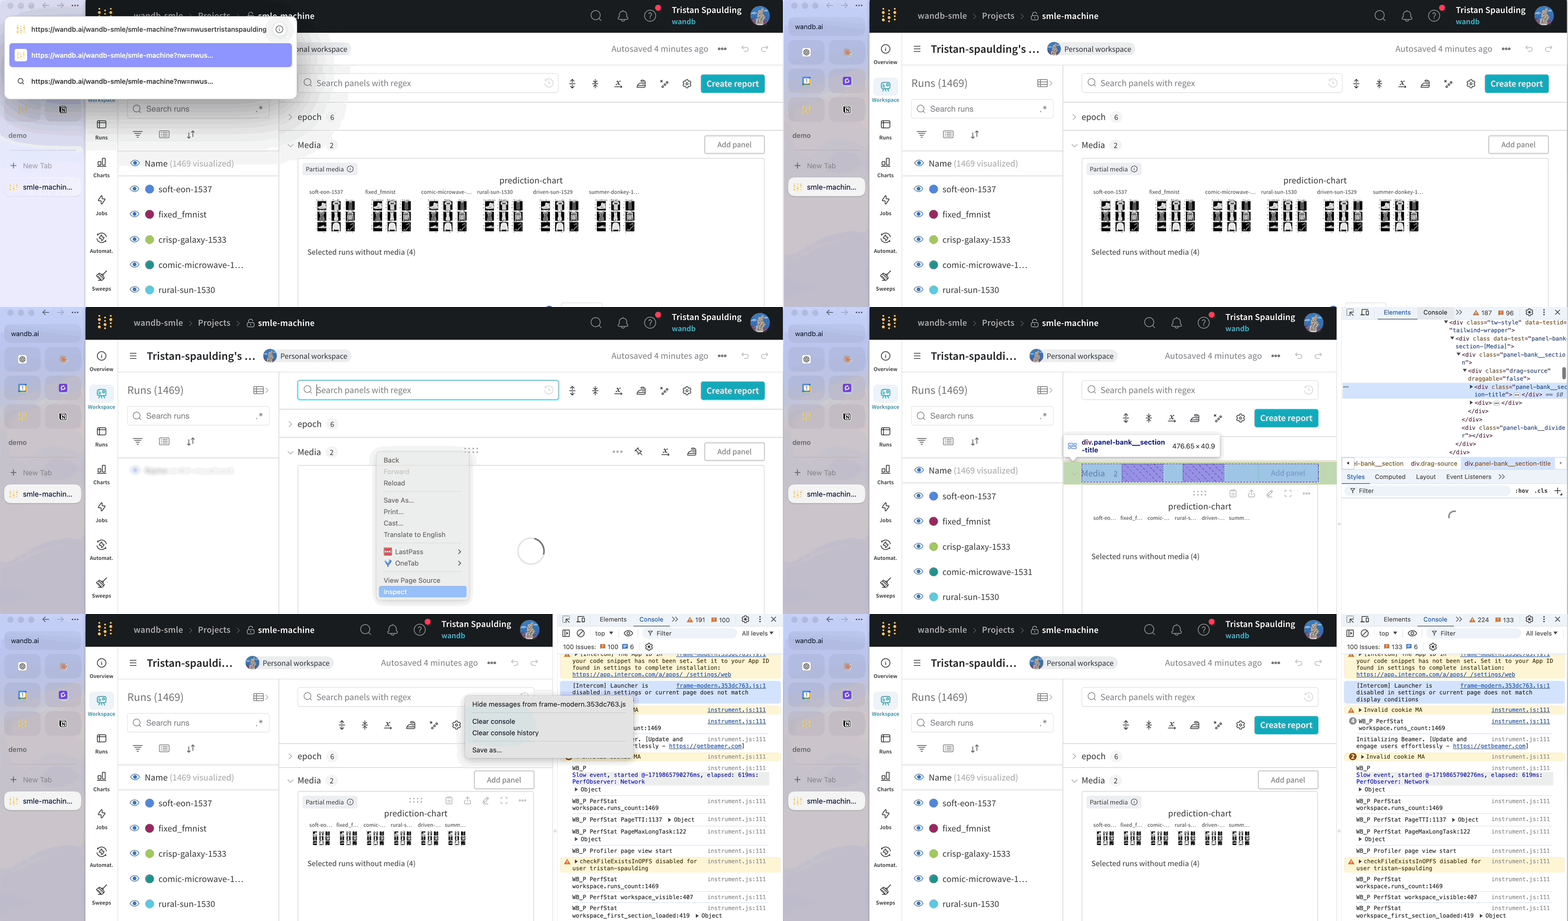
W&B takes performance seriously and investigates every report of lag. To expedite investigation, when reporting slow loading times consider invoking W&B’s built-in performance logger that captures key metrics and performance events. Append the URL parameter&PERF_LOGGING to a page that is loading slowly, then share the output of your console with your account team or Support.
