- Initialize a W&B Run and synchronize all configs associated with the run for reproducibility.
- MONAI transform API:
- MONAI Transforms for dictionary format data.
- How to define a new transform according to MONAI
transformsAPI. - How to randomly adjust intensity for data augmentation.
- Data Loading and Visualization:
- Load
Niftiimage with metadata, load a list of images and stack them. - Cache IO and transforms to accelerate training and validation.
- Visualize the data using
wandb.Tableand interactive segmentation overlay on W&B.
- Load
- Training a 3D
SegResNetmodel- Using the
networks,losses, andmetricsAPIs from MONAI. - Training the 3D
SegResNetmodel using a PyTorch training loop. - Track the training experiment using W&B.
- Log and version model checkpoints as model artifacts on W&B.
- Using the
- Visualize and compare the predictions on the validation dataset using
wandb.Tableand interactive segmentation overlay on W&B.
Setup and Installation
First, install the latest version of both MONAI and W&B.Initialize a W&B Run
Start a new W&B Run to start tracking the experiment. Use of proper config system is a recommended best practice for reproducible machine learning. You can track the hyperparameters for every experiment using W&B.Data Loading and Transformation
Here, use themonai.transforms API to create a custom transform that converts the multi-classes labels into multi-labels segmentation task in one-hot format.
The Dataset
The dataset used for this experiment comes from http://medicaldecathlon.com/. It uses multi-modal multi-site MRI data (FLAIR, T1w, T1gd, T2w) to segment Gliomas, necrotic/active tumour, and oedema. The dataset consists of 750 4D volumes (484 Training + 266 Testing). Use theDecathlonDataset to automatically download and extract the dataset. It inherits MONAI CacheDataset which enables you to set cache_num=N to cache N items for training and use the default arguments to cache all the items for validation, depending on your memory size.
Note: Instead of applying the
train_transform to the train_dataset, apply val_transform to both the training and validation datasets. This is because, before training, you would be visualizing samples from both the splits of the dataset.Visualizing the Dataset
W&B supports images, video, audio, and more. You can log rich media to explore your results and visually compare our runs, models, and datasets. Use the segmentation mask overlay system to visualize our data volumes. To log segmentation masks in tables, you must provide awandb.Image object for each row in the table.
An example is provided in the pseudocode below:
wandb.Table object and some associated metadata and populate the rows of a table that would be logged to the W&B dashboard.
wandb.Table object and what columns it consists of so that it can populate with the data visualizations.
train_dataset and val_dataset respectively to generate the visualizations for the data samples and populate the rows of the table which to log to the dashboard.
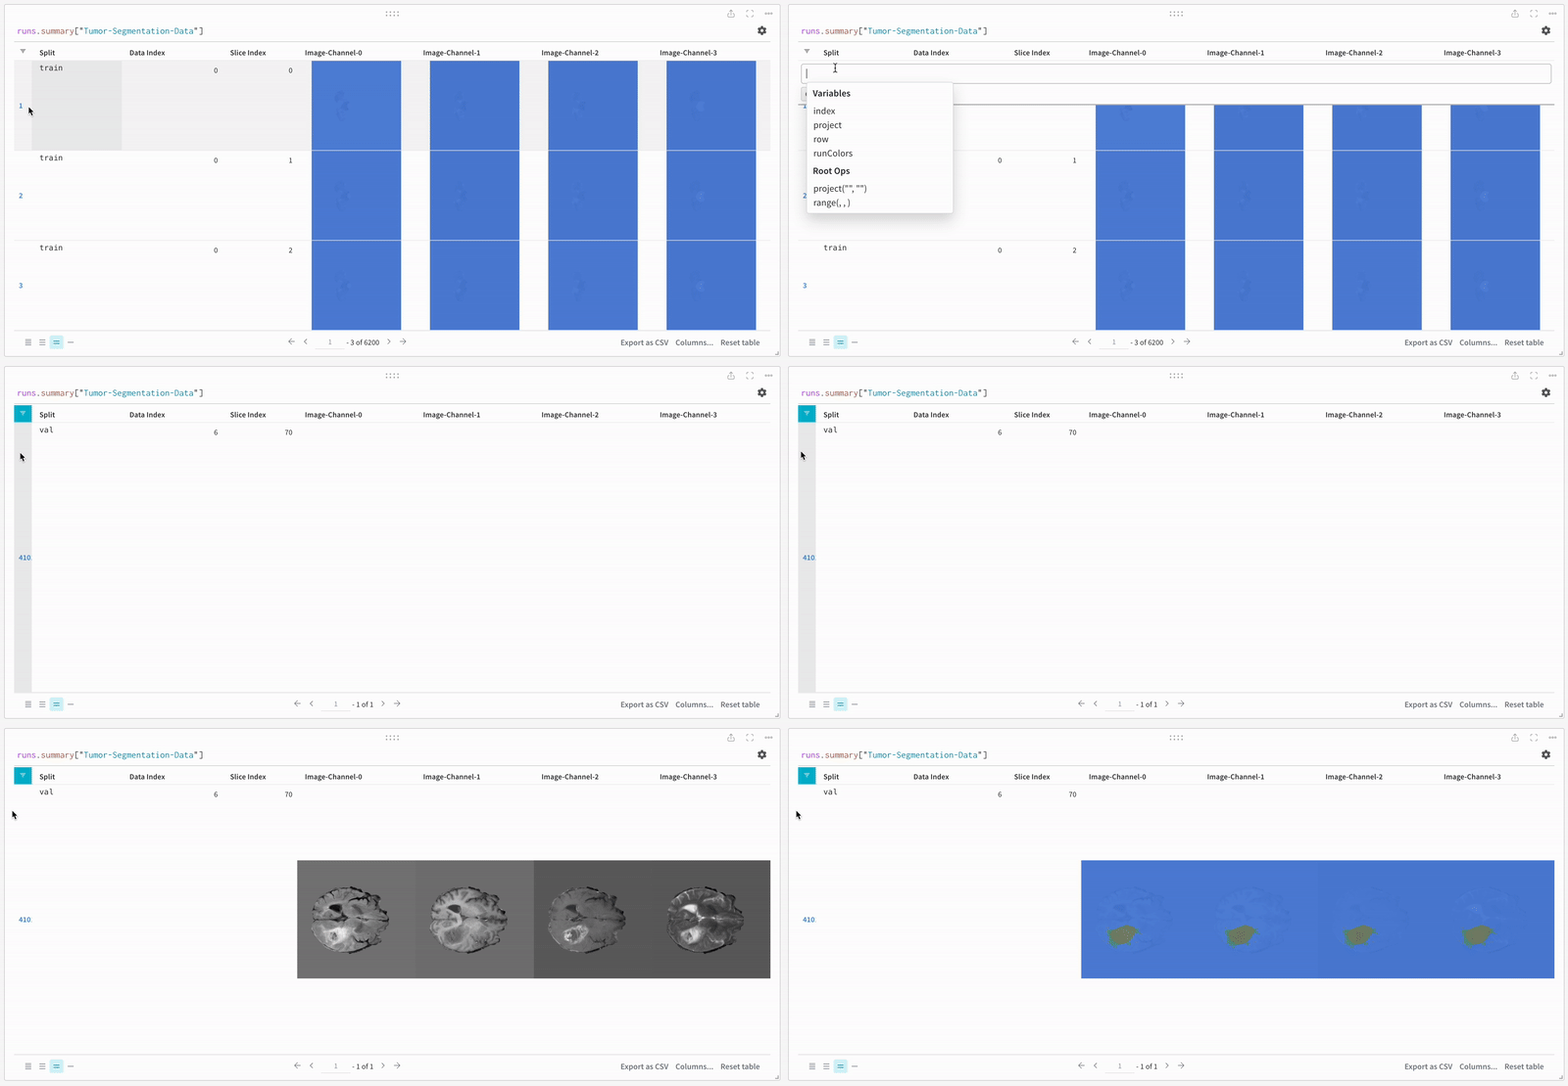
An example of logged table data.
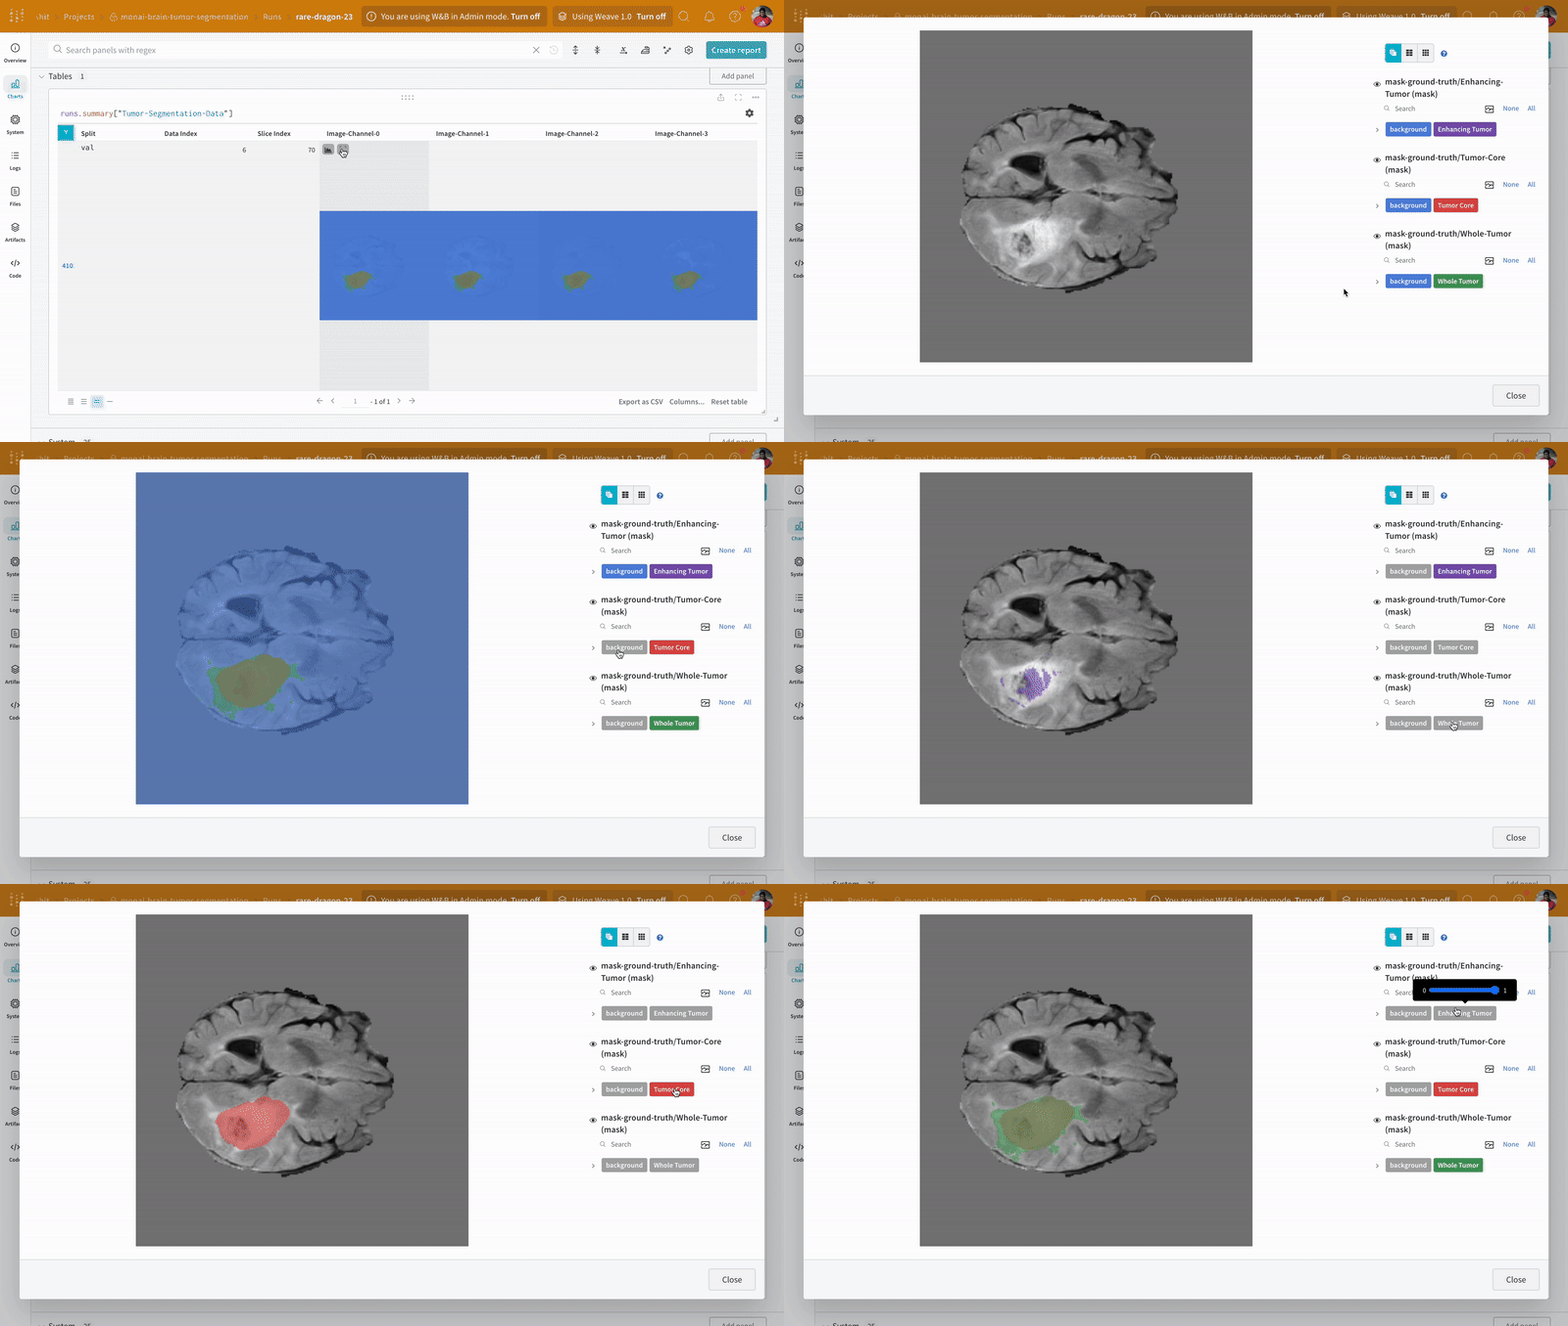
An example of visualized segmentation maps.
Note: The labels in the dataset consist of non-overlapping masks across classes. The overlay logs the labels as separate masks in the overlay.
Loading the Data
Create the PyTorch DataLoaders for loading the data from the datasets. Before creating the DataLoaders, set thetransform for train_dataset to train_transform to pre-process and transform the data for training.
Creating the Model, Loss, and Optimizer
This tutorial crates aSegResNet model based on the paper 3D MRI brain tumor segmentation using auto-encoder regularization. The SegResNet model that comes implemented as a PyTorch Module as part of the monai.networks API as well as an optimizer and learning rate scheduler.
DiceLoss using the monai.losses API and the corresponding dice metrics using the monai.metrics API.
Training and Validation
Before training, define the metric properties which will later be logged withrun.log() for tracking the training and validation experiments.
Execute Standard PyTorch Training Loop
wandb.log not only enables tracking all metrics associated with the training and validation process, but also logs all system metrics (our CPU and GPU in this case) on the W&B dashboard.
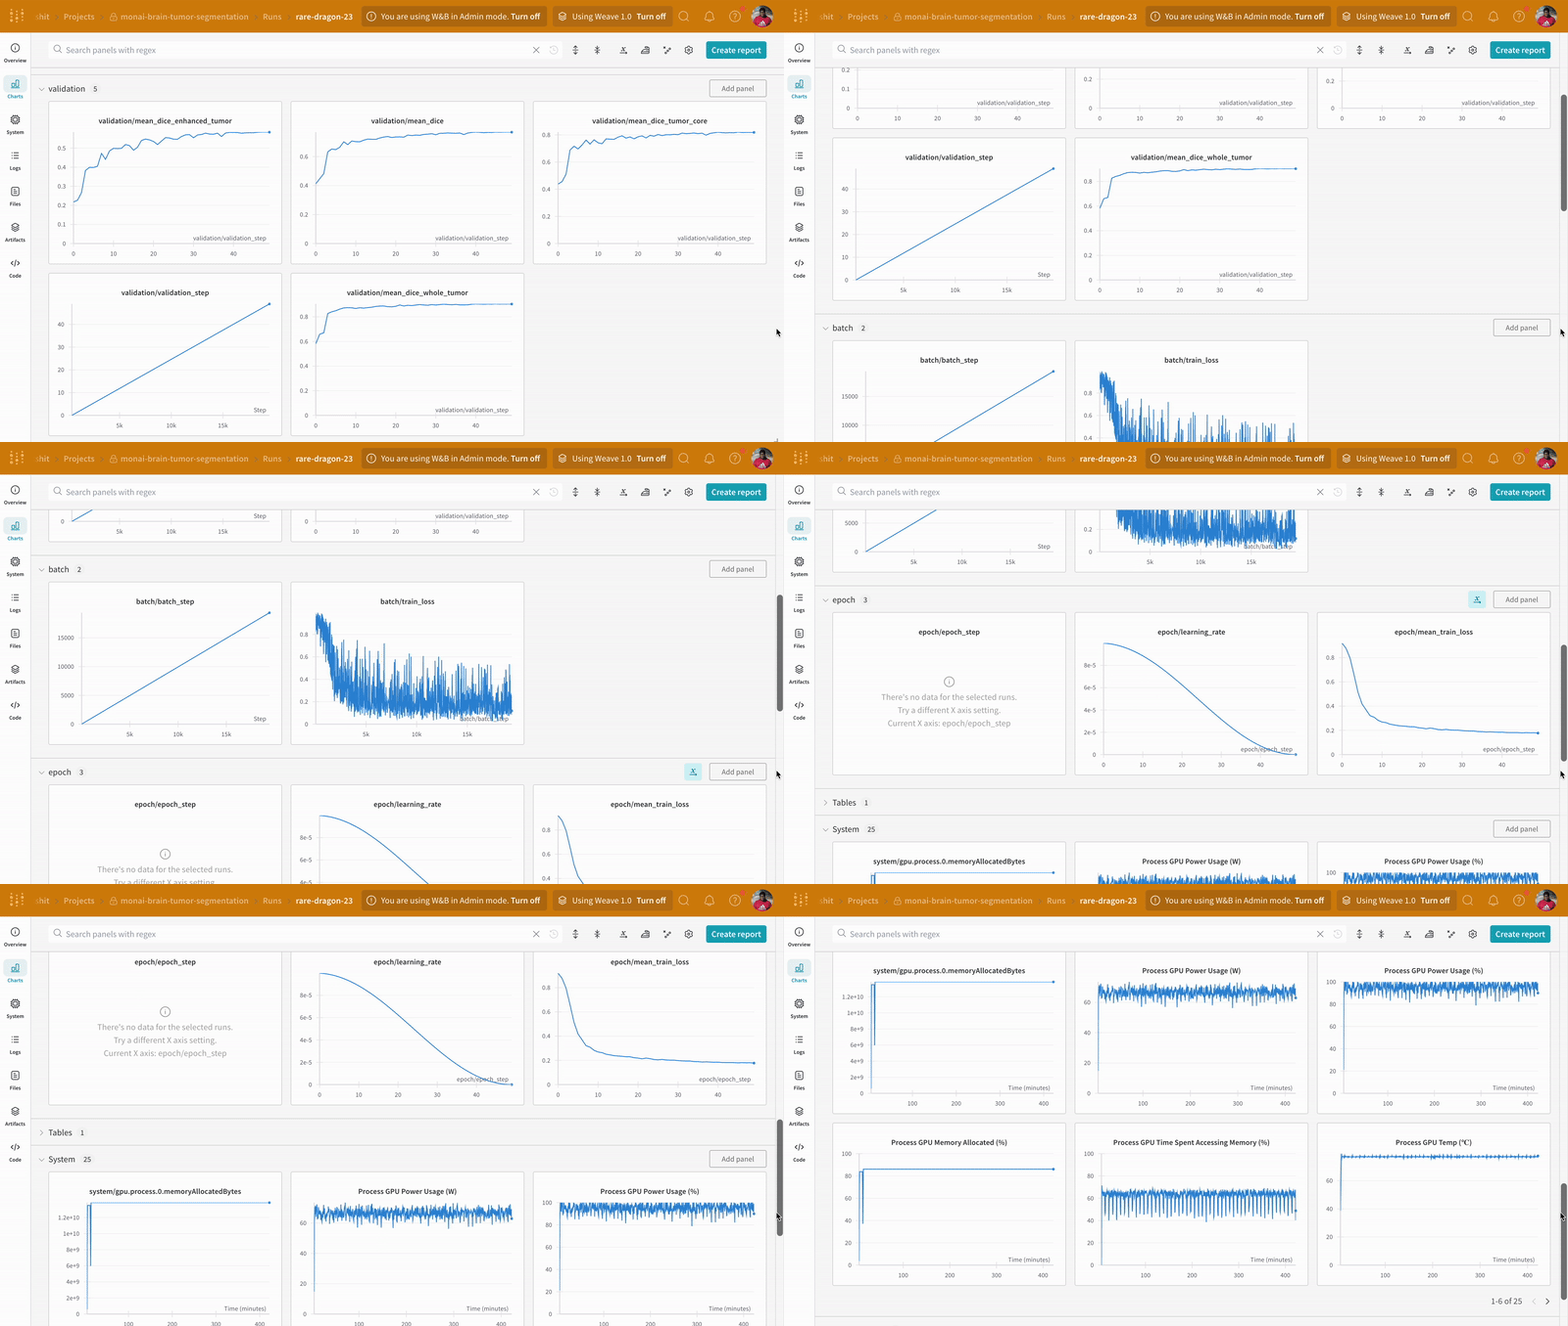
An example of training and validation process tracking on W&B.
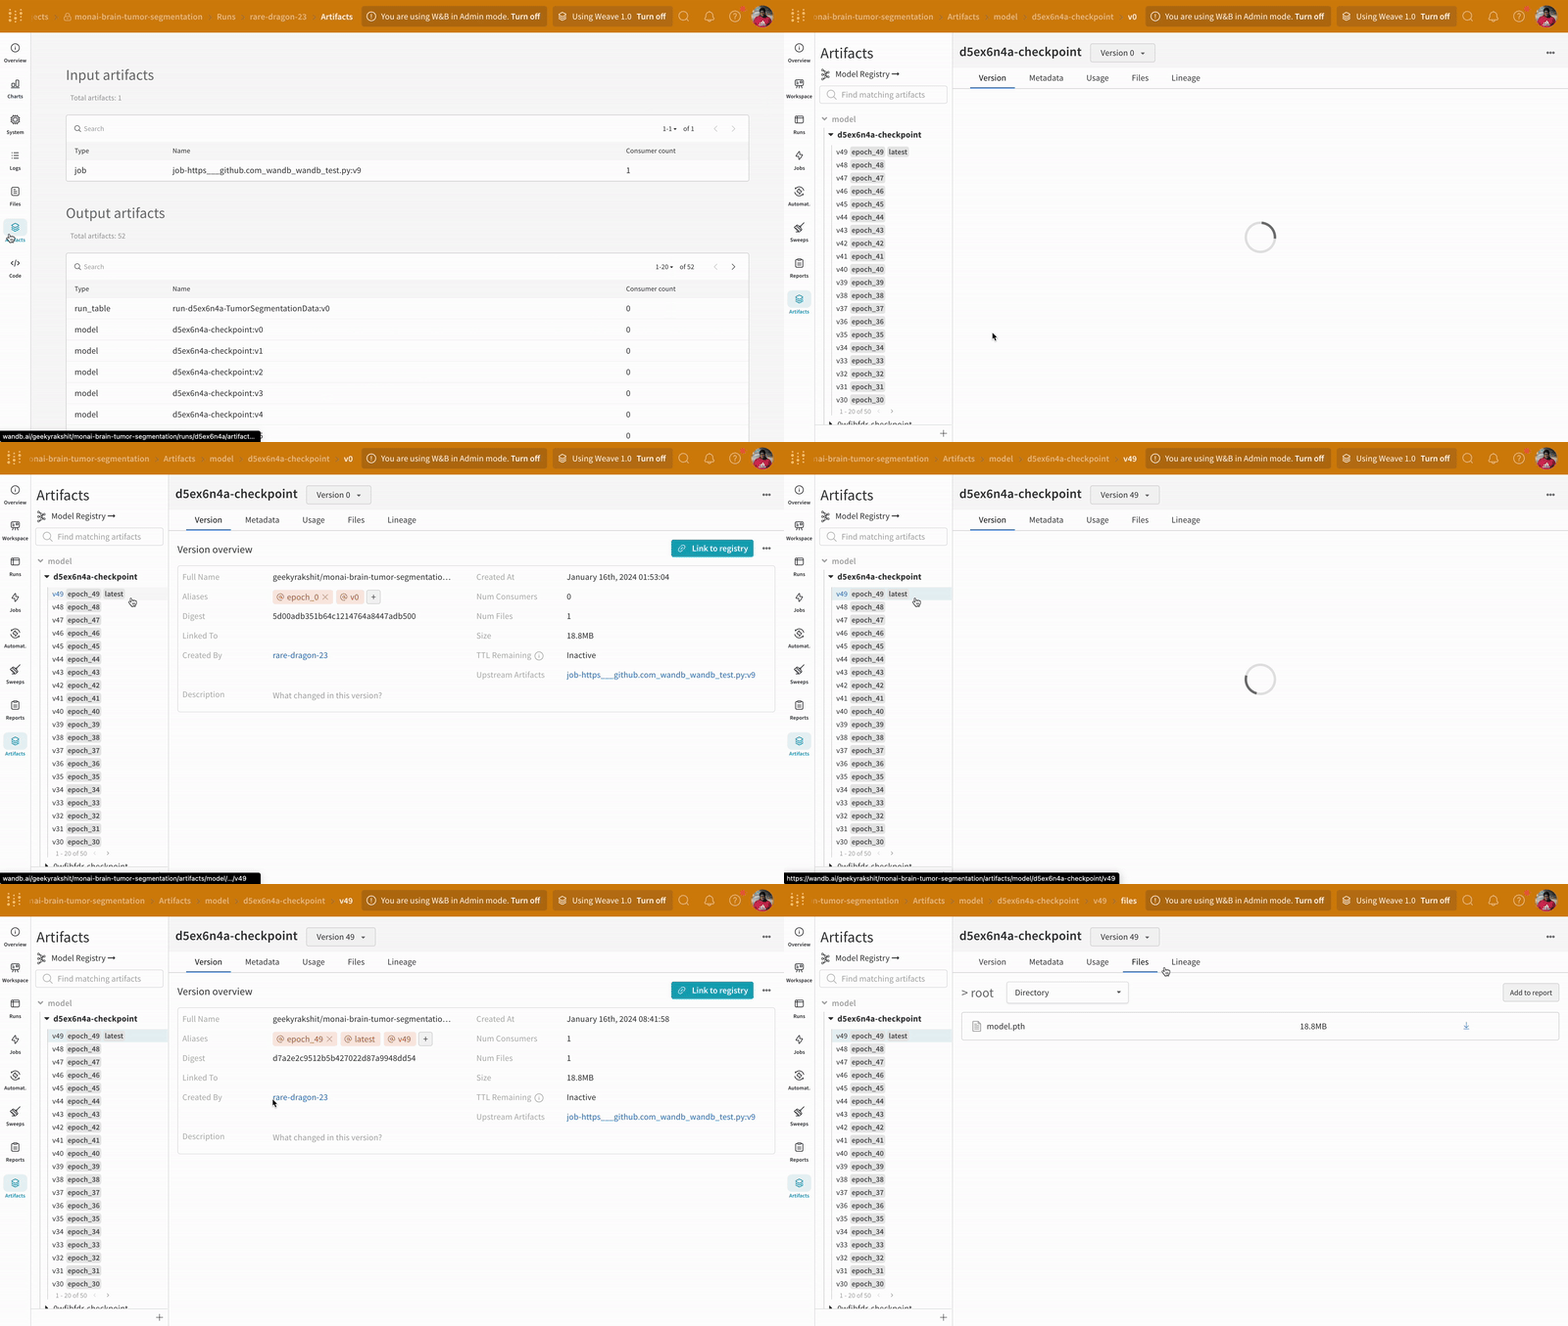
An example of model checkpoints logging and versioning on W&B.
Inference
Using the artifacts interface, you can select which version of the artifact is the best model checkpoint, in this case, the mean epoch-wise training loss. You can also explore the entire lineage of the artifact and use the version that you need.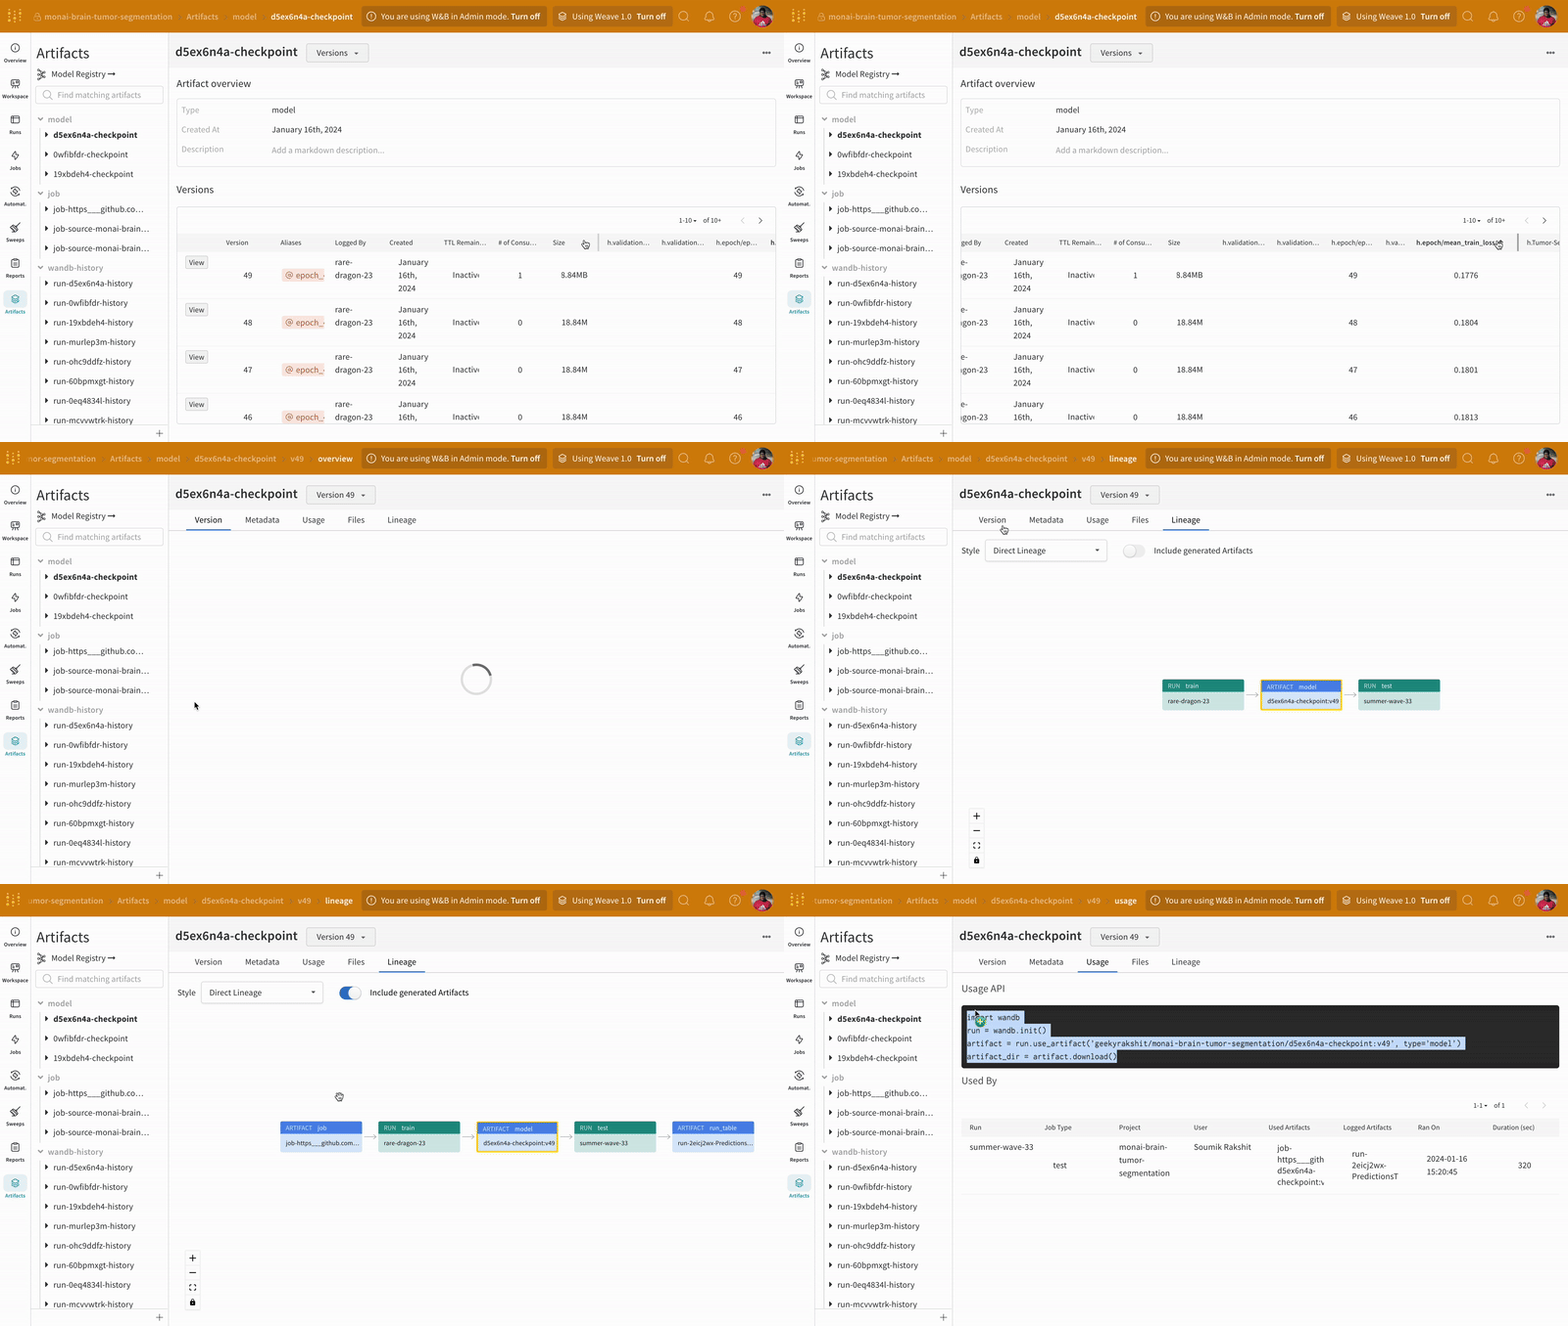
An example of model artifact tracking on W&B.
Visualizing Predictions and Comparing with the Ground Truth Labels
Create another utility function to visualize the predictions of the pre-trained model and compare them with the corresponding ground-truth segmentation mask using the interactive segmentation mask overlay,.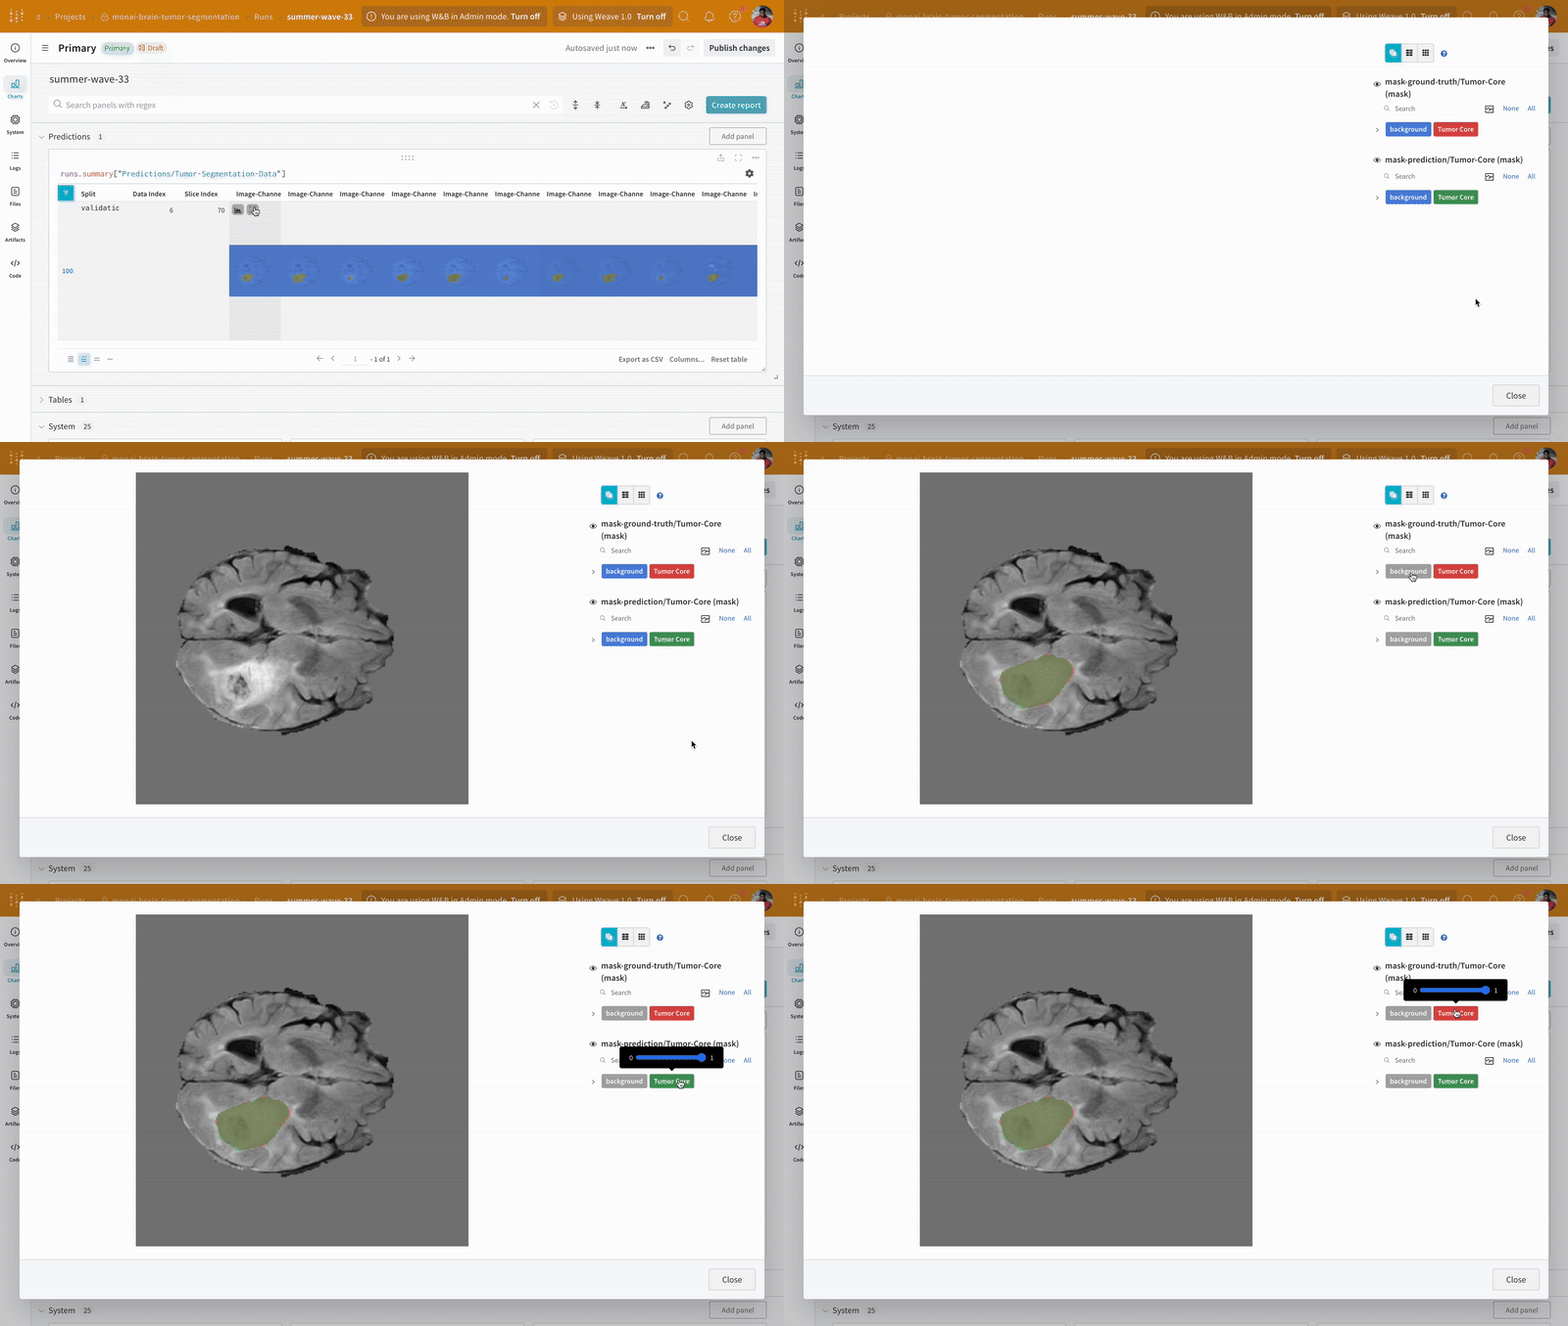
An example of predictions and ground-truth visualization on W&B.