- Organize Runs.
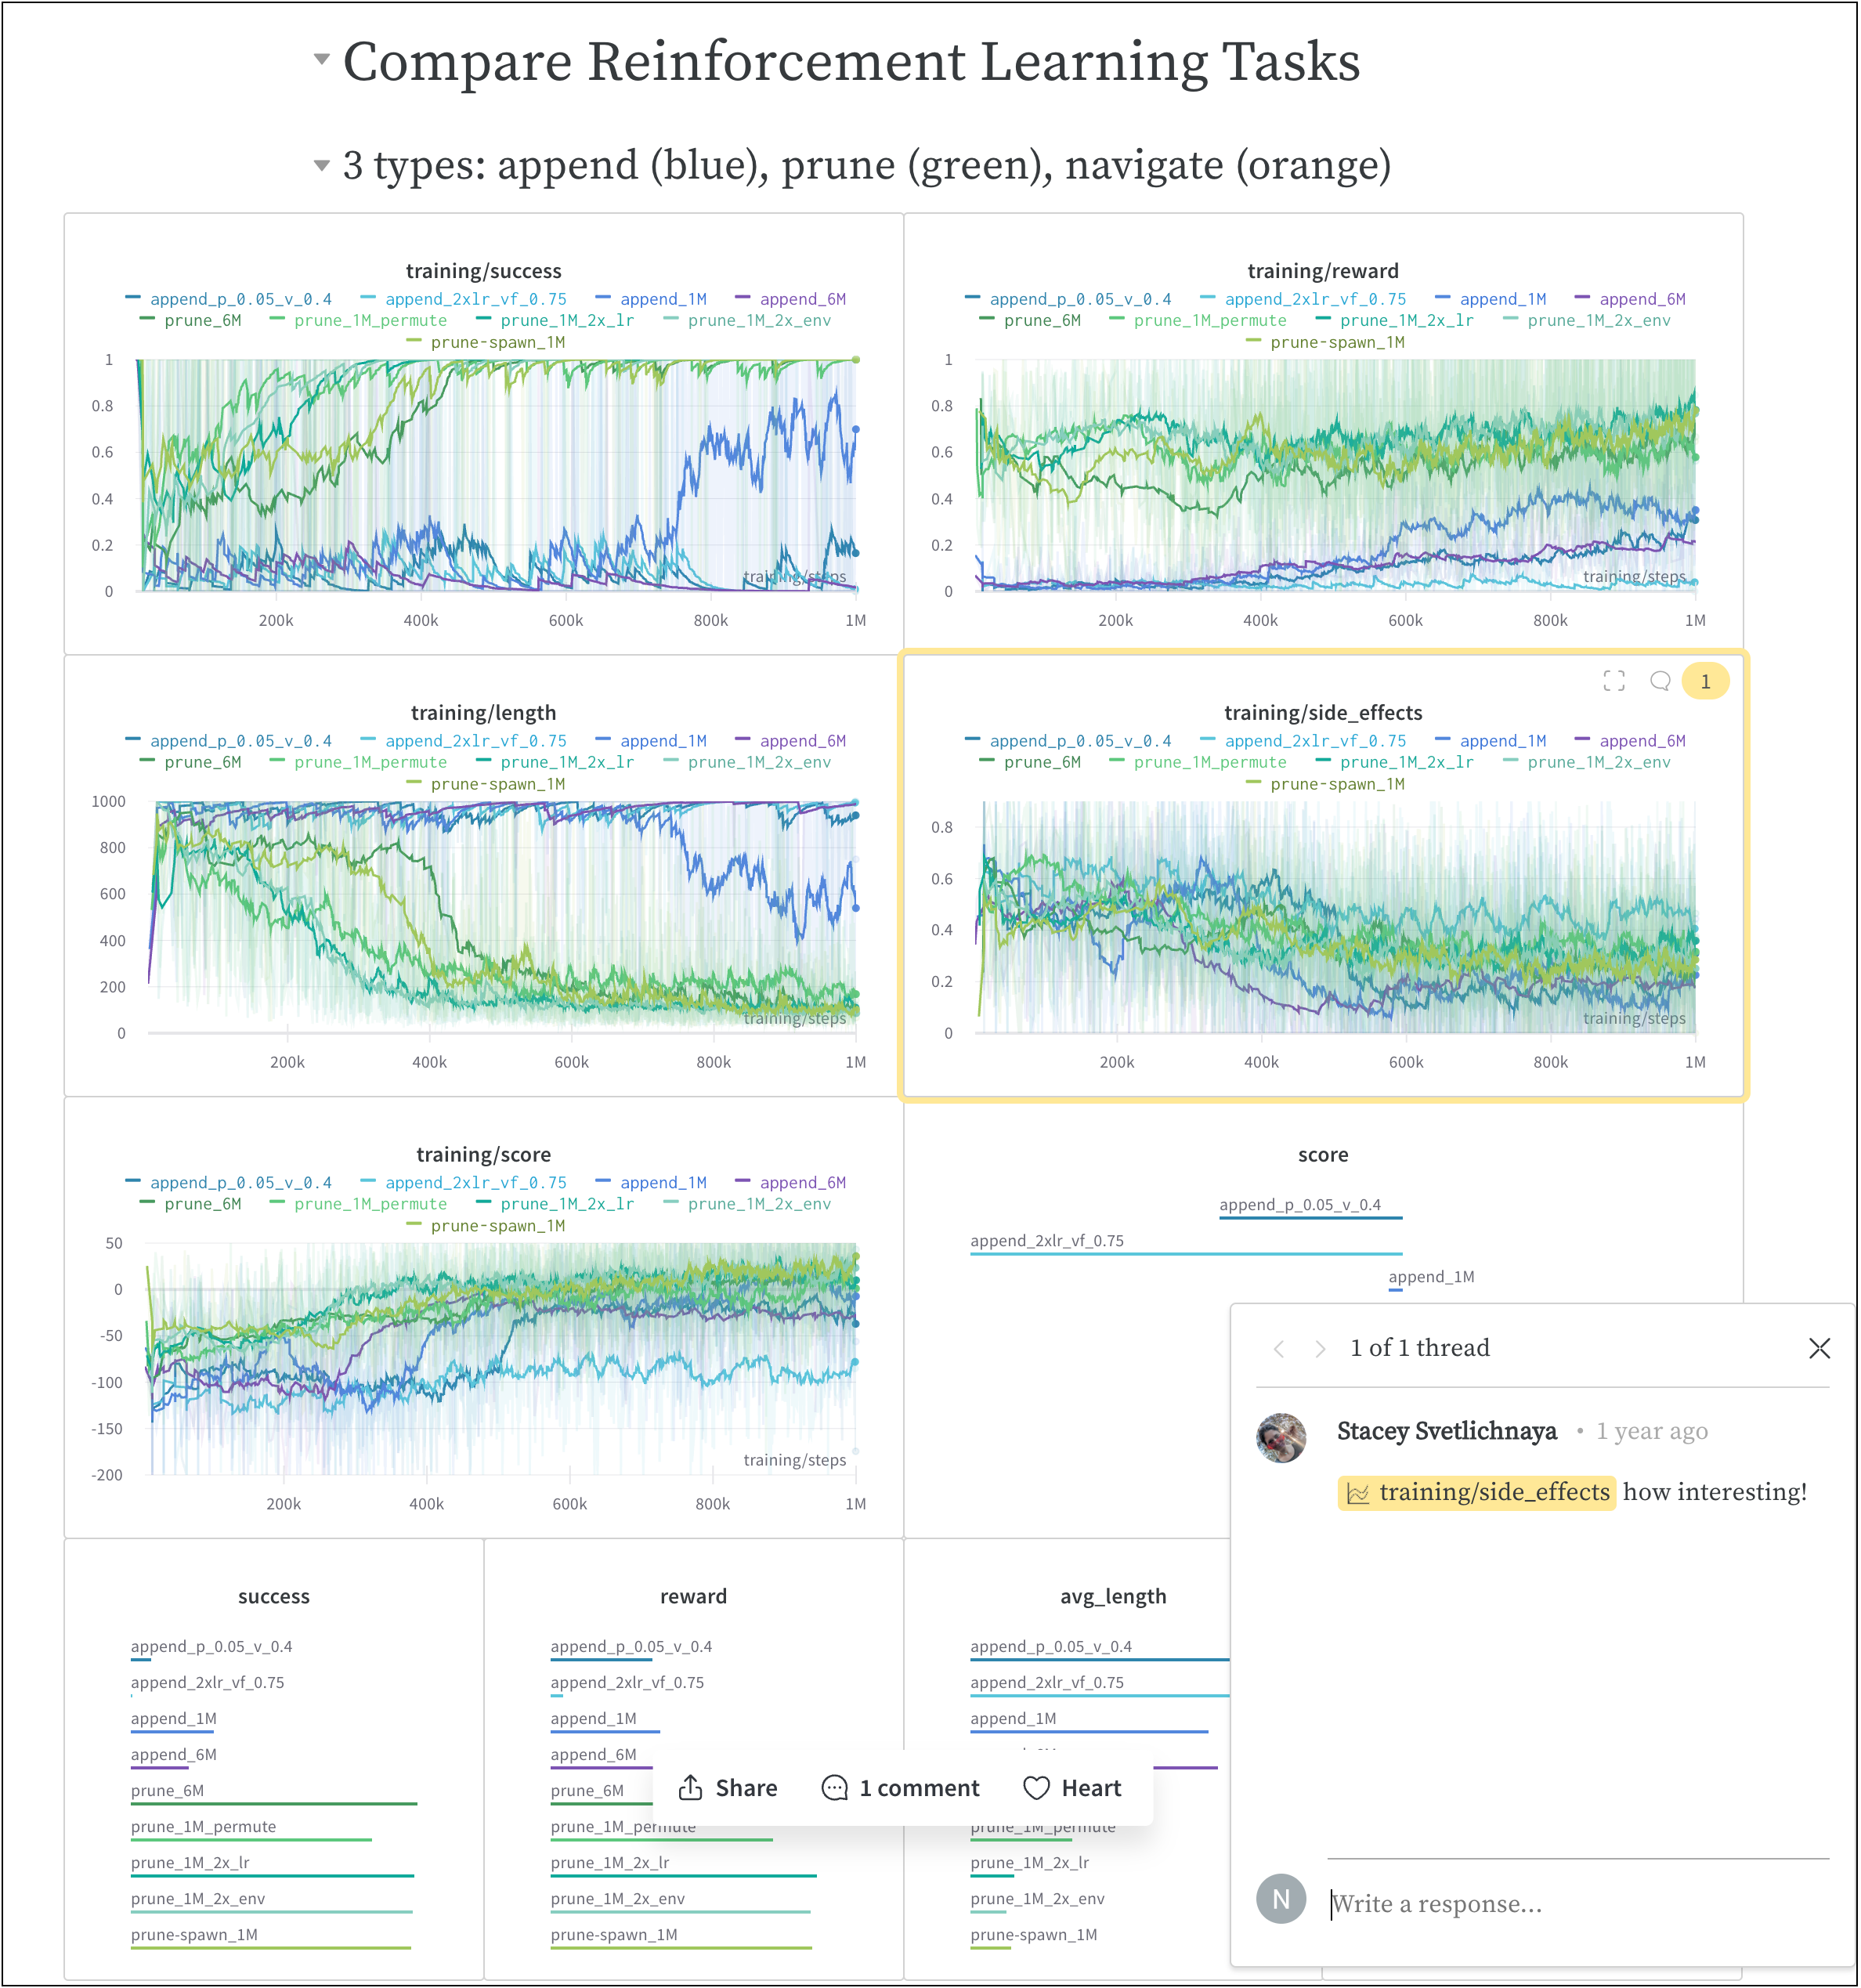
- Embed and automate visualizations.
- Describe your findings.
- Share updates with collaborators, either as a LaTeX zip file or a PDF.
How it works
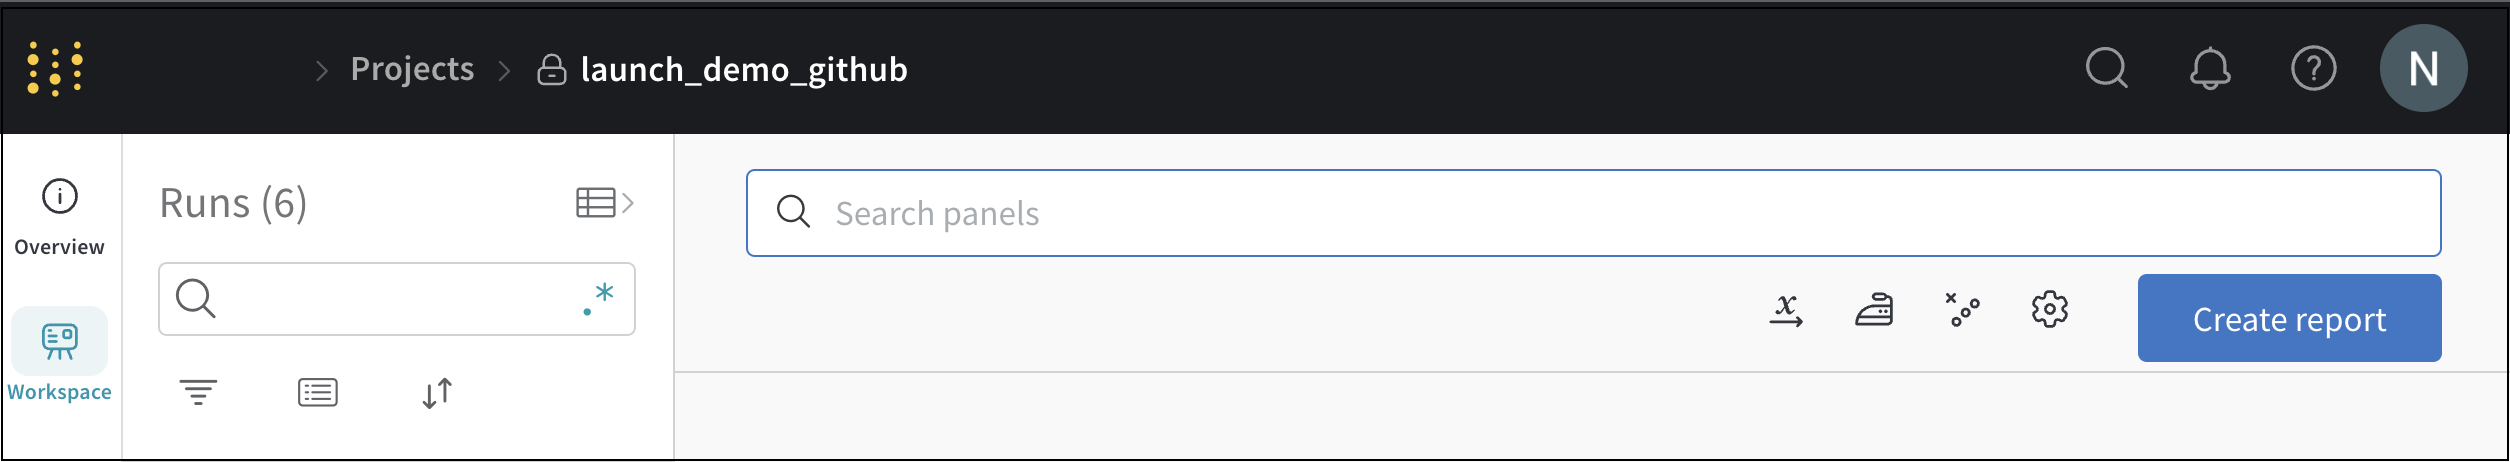
Create a collaborative report with a few clicks.- Navigate to your W&B project workspace in the W&B App.
- Click the Create report button in the upper right corner of your workspace.
- A modal titled Create Report will appear. Select the charts and panels you want to add to your report. (You can add or remove charts and panels later).
- Click Create report.
- Edit the report to your desired state.
- Click Publish to project.
- Click the Share button to share your report with collaborators.
How to get started
Depending on your use case, explore the following resources to get started with W&B Reports:- Check out our video demonstration to get an overview of W&B Reports.
- Explore the Reports gallery for examples of live reports.
- Try the Programmatic Workspaces notebook to learn how to create and customize your workspace.
- Read curated Reports in W&B Fully Connected.