Looking for W&B Weave, W&B’s suite of tools for generative AI application building? See the Weave documentation.
- Expression: The data you select.
- Configuration: Optional settings for the panel, such as the panel type and options from the gear menu.
- Result panel: How to show the results, such as in a table or plot.
Create a query panel
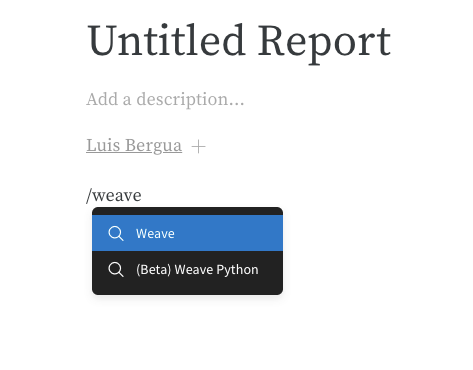
Add a query panel so you have a surface to write expressions against and visualize the results. You can add one to a project workspace or within a report.- Project workspace
- W&B Report
- Navigate to your project’s workspace.
- In the upper-right corner, click Add panel.
- From the dropdown menu, select Query panel.
Query components
The following sections describe the three pieces that make up a query panel: the expression that selects data, the configuration that controls how the panel behaves, and the result panel that renders the output.Expressions
Use query expressions to query your data stored in W&B such as runs, artifacts, models, tables, and more.Example: Query a table
Suppose you want to query a W&B Table. In your training code, you log a table called"cifar10_sample_table":
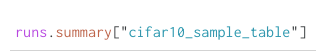
runsis a variable automatically injected in query panel expressions when the query panel is in a workspace. Its value is the list of runs visible for that workspace. For details about the different attributes available within a run, see Understanding the different attributes.summaryis an op that returns the Summary object for a run. Ops are mapped, meaning this op is applied to each run in the list, resulting in a list of Summary objects.["cifar10_sample_table"]is a Pick op (denoted with brackets) with a key ofcifar10_sample_table. Because Summary objects act like dictionaries or maps, this operation picks that field from each Summary object.
Configurations
In the upper-left corner of the panel, click the gear icon to expand the query configuration. The configuration lets you set the type of panel and the parameters for the result panel.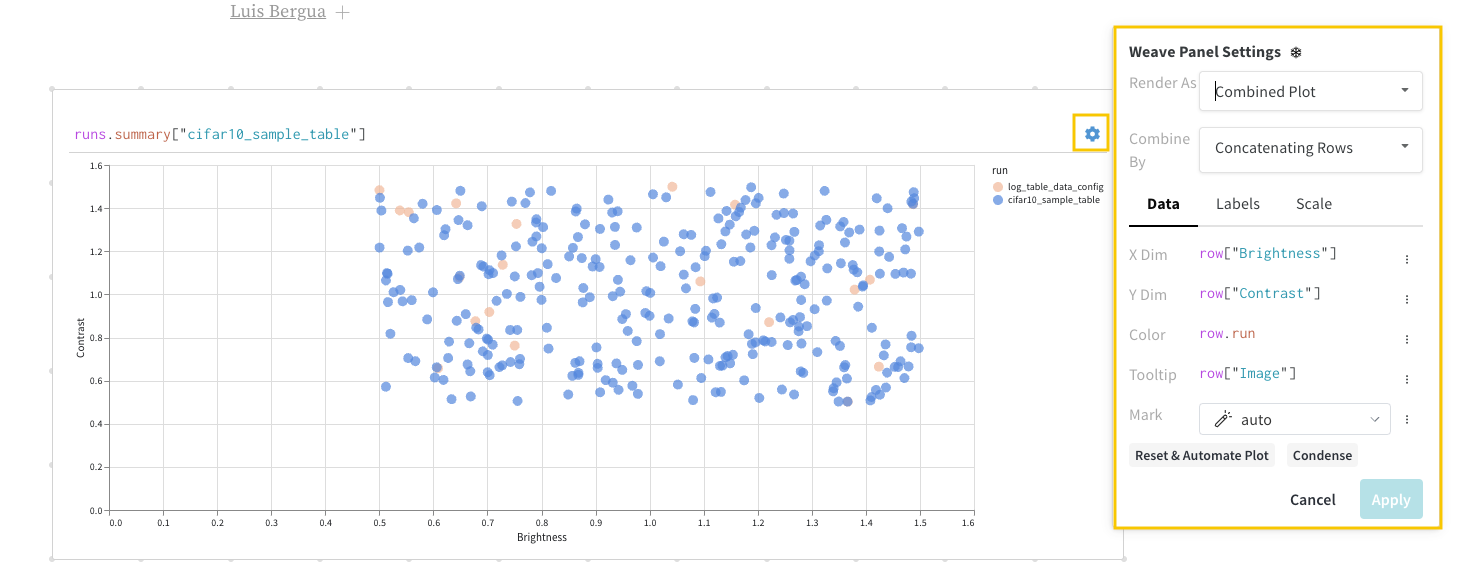
Panel options
The configuration menu can include options that change how the panel combines or loads table-style results. Exact labels and availability depend on your expression and panel type. For concrete setups, see the Query panel examples report. Concat Use Concat in the configuration when you want the panel to merge compatible table-style results and treat them as a single table for viewing and downstream operations. Expression-level row merging (for example,concat and join in the query) is separate from this setting. For more information, see Combine tables in expressions.
Paginate
Use Paginate when a table result might be too large to render at once. Pagination loads rows in chunks so the panel stays responsive. Pair this option with expressions that return large row lists. For patterns that work well with pagination, see the Query panel examples report.
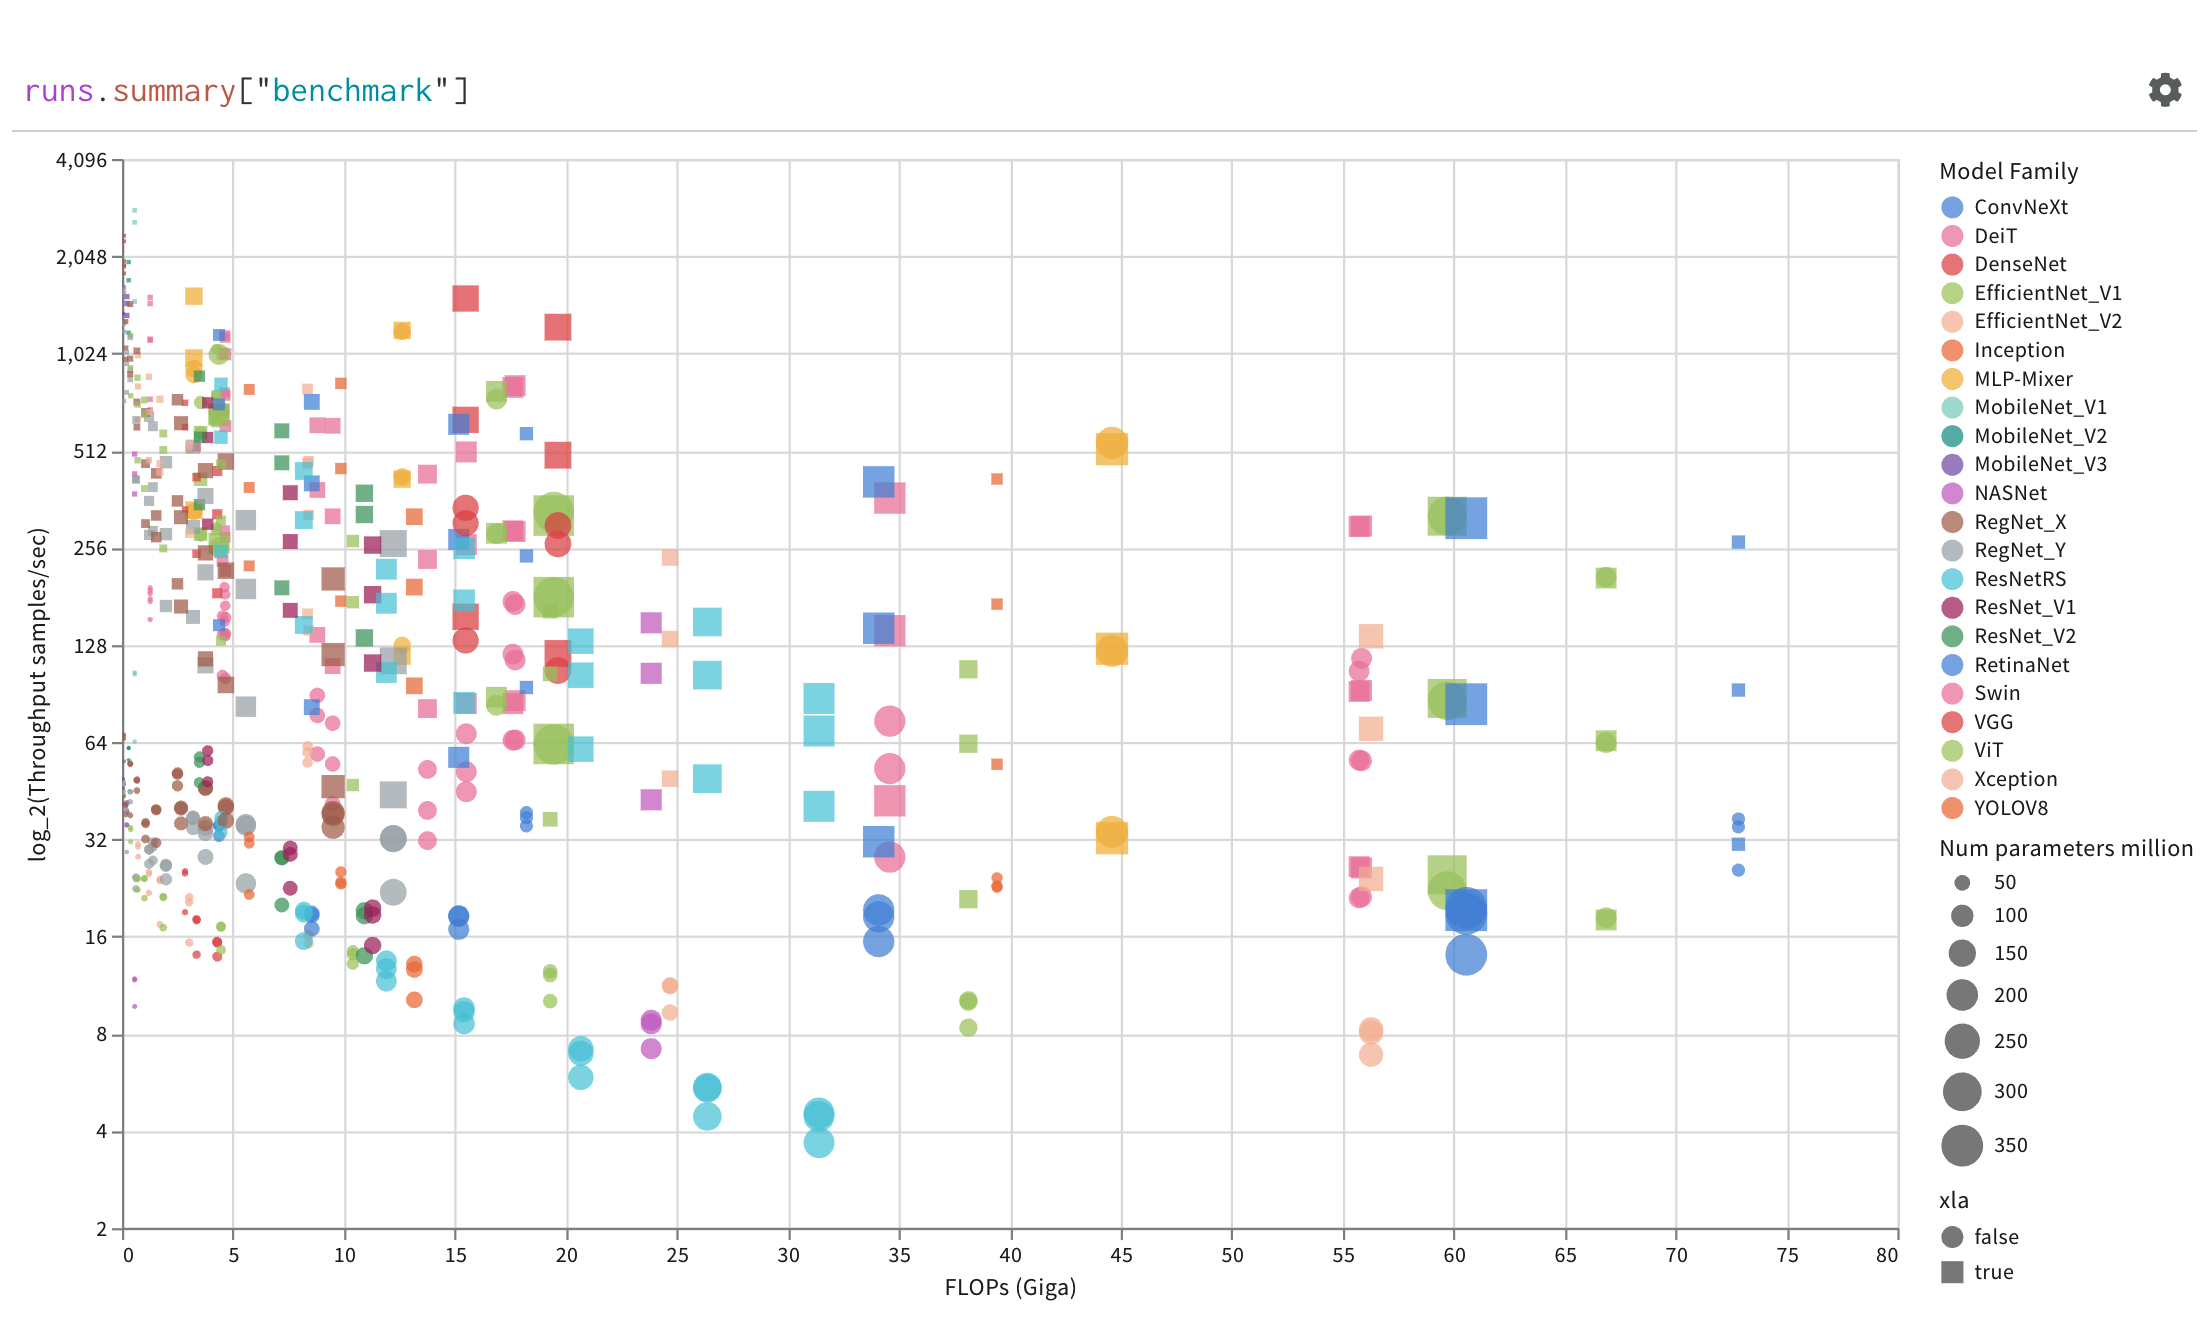
Result panels
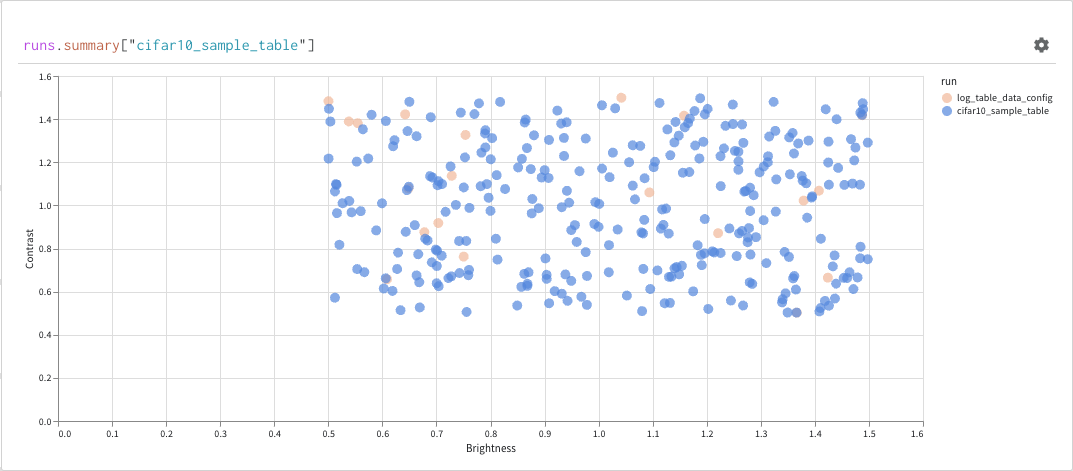
The query result panel renders the result of the query expression, using the selected query panel, configured to display the data in an interactive form. The following images show a Table and a Plot of the same data.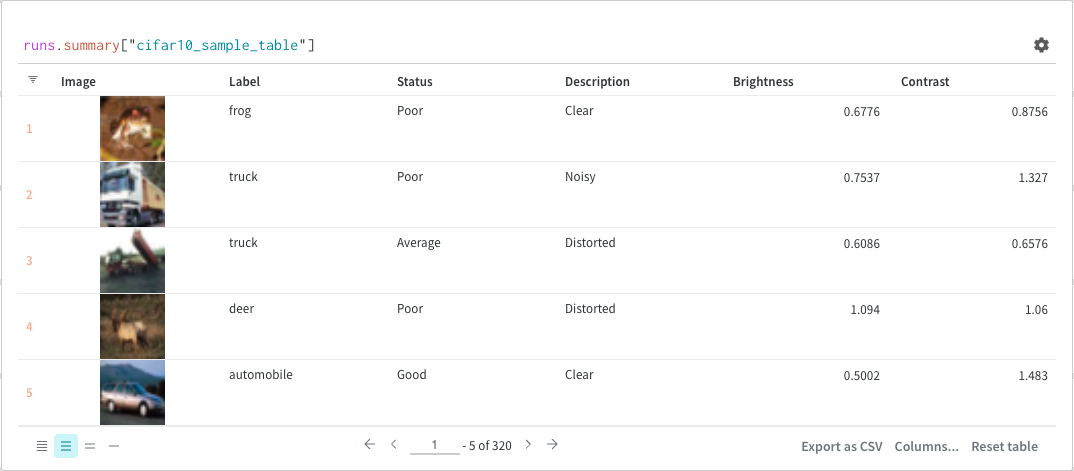
Step through run history
In tables and plots built fromruns or runs.history, the app can show a step control (for example, a slider) so you can move through logged steps and inspect metrics, text, or media over the course of your runs. After you change the expression, edit the query panel’s configuration and change Render As to Stepper. The control can follow a different metric instead of _step if it better matches how you logged data. For sample expressions, see the Query panel examples report.
Basic operations
After a query panel renders results, you can refine what you see by sorting, filtering, mapping, or grouping the rows. The following are common operations you can perform within your query panels.Sort
Sort from the column options: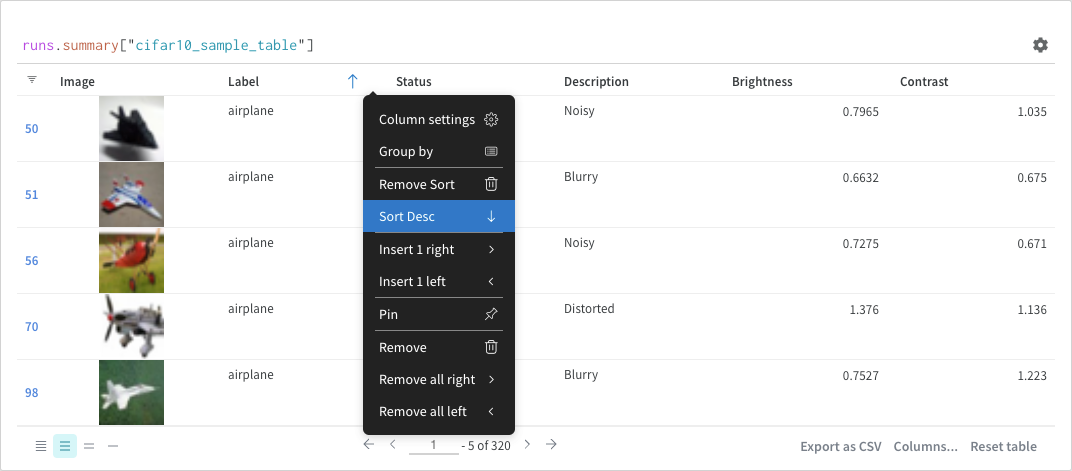
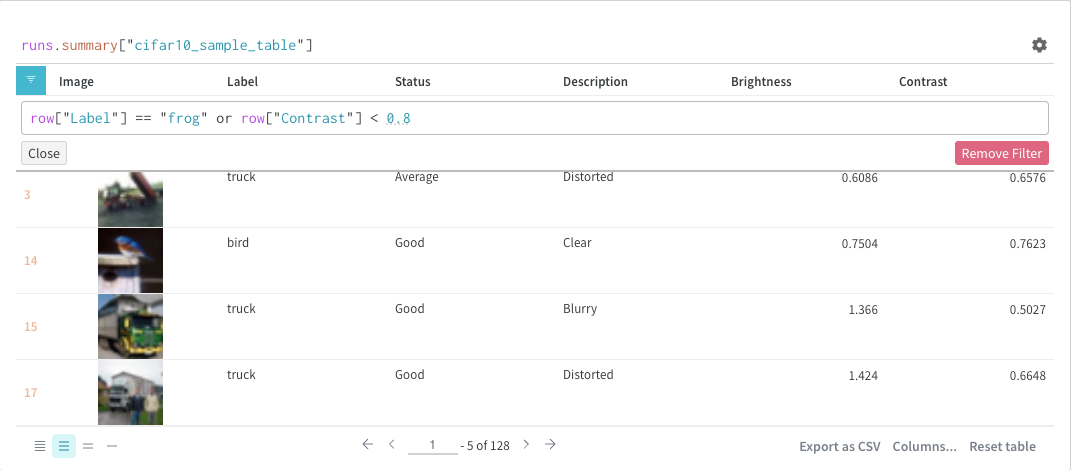
Filter
You can either filter directly in the query or use the filter button in the upper-left corner of the panel.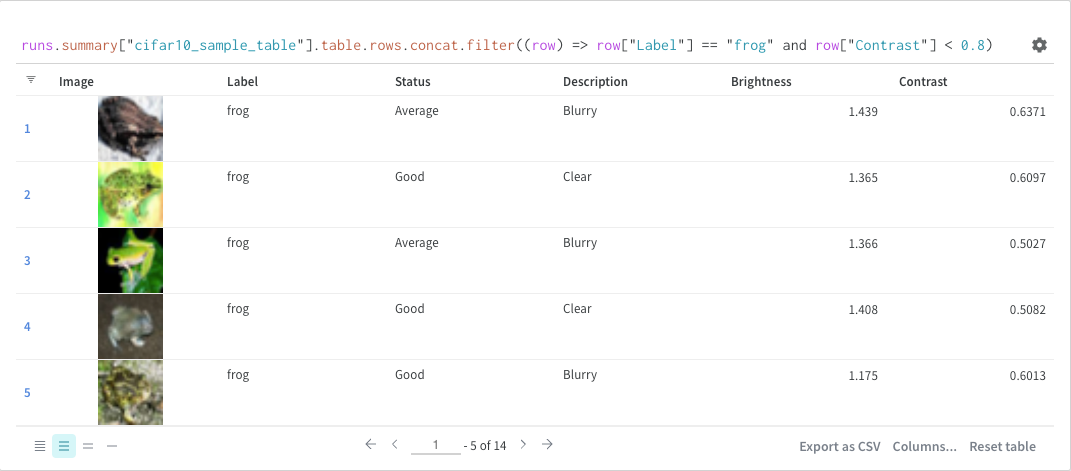
Map
Map operations iterate over lists and apply a function to each element in the data. You can do this directly with a panel query or by inserting a new column from the column options.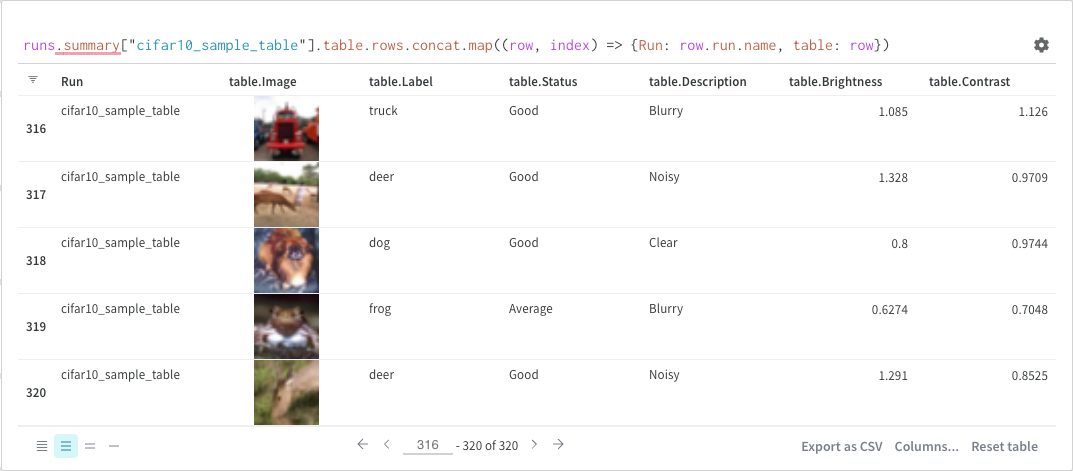
Group by
You can group by using a query or from the column options.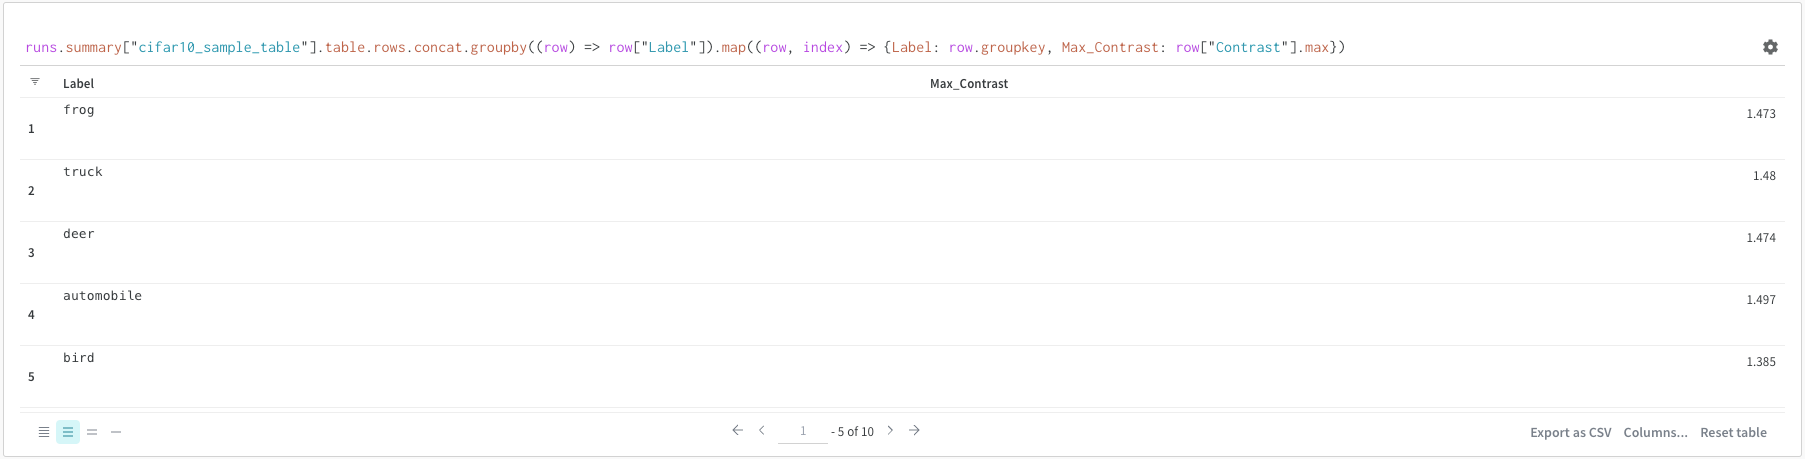
Combine tables in expressions
Useconcat, join, and related ops in your expression when you need to stack or merge row lists from tables. See Join for a full example. The Concat and Paginate items in Panel options are separate controls for how the UI merges and loads table results.
Join
You can also join tables directly in the query. Consider the following query expression: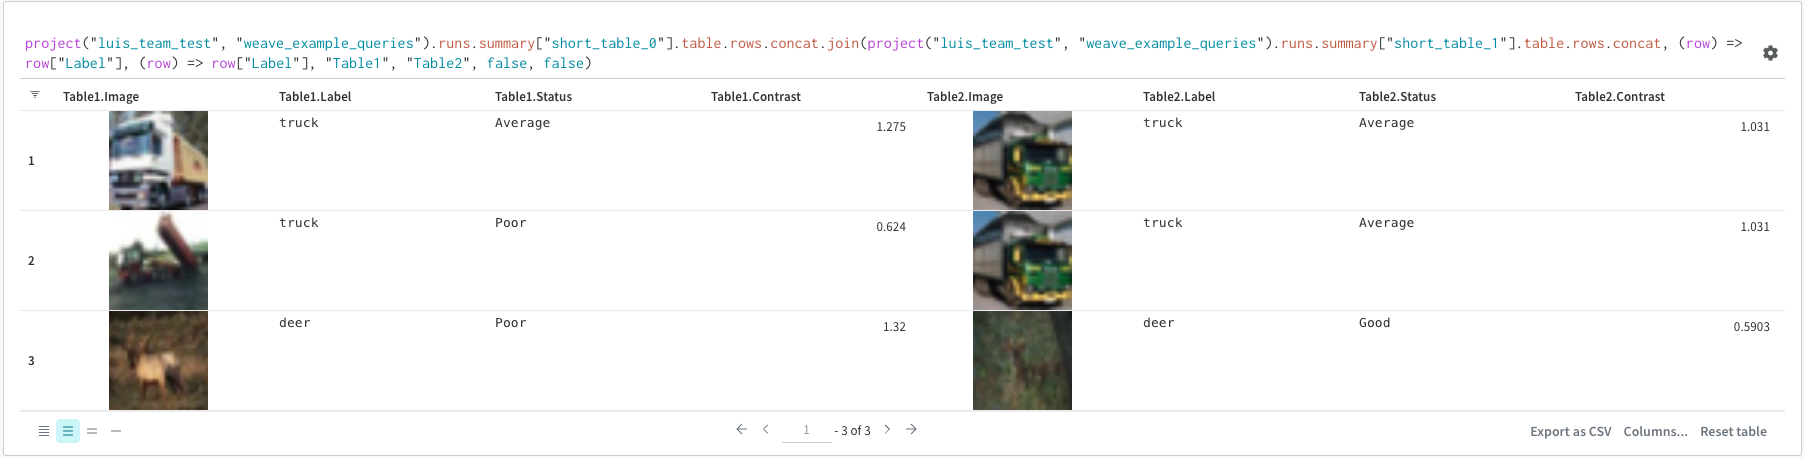
(row) => row["Label"]are selectors for each table, determining which column to join on."Table1"and"Table2"are the names of each table when joined.trueandfalseare for left and right inner/outer join settings.
Runs object
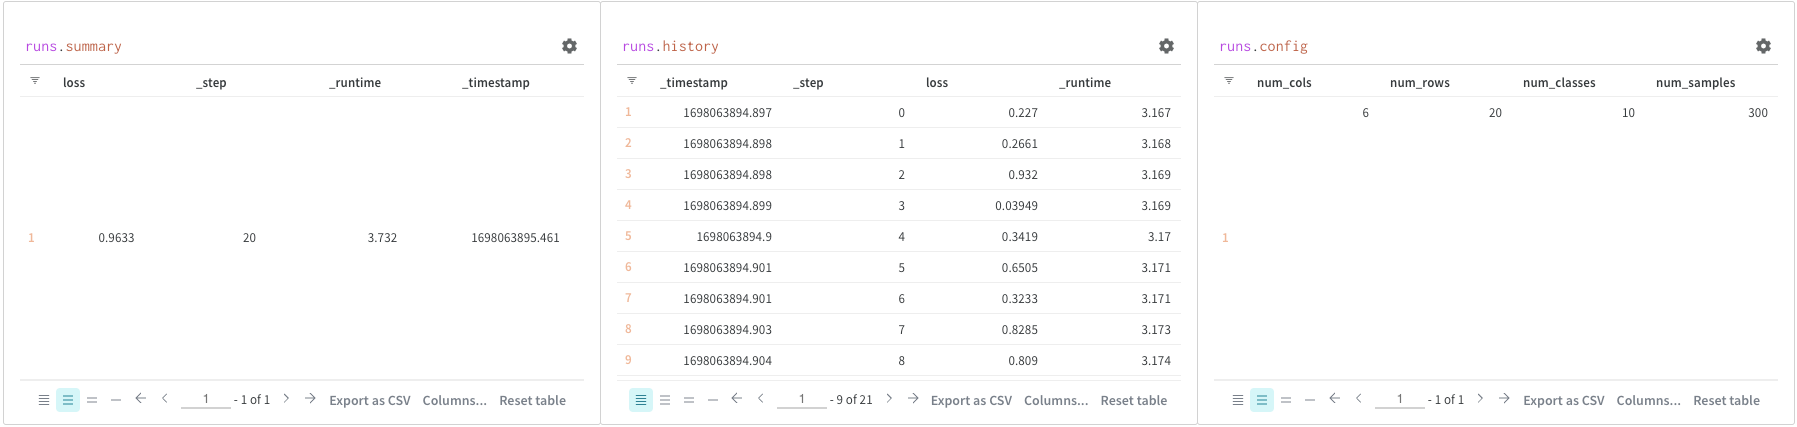
Use query panels to access theruns object. Run objects store records of your experiments. For more details, see Accessing runs object. As a quick overview, the runs object has the following available:
summary: A dictionary of information that summarizes the run’s results. The summary can contain scalars like accuracy and loss, or large files. By default,wandb.Run.log()sets the summary to the final value of a logged time series. You can set the contents of the summary directly. Think of the summary as the run’s outputs.history: A list of dictionaries meant to store values that change while the model is training, such as loss. The commandwandb.Run.log()appends to this object.config: A dictionary of the run’s configuration information, such as the hyperparameters for a training run or the preprocessing methods for a run that creates a dataset artifact. Think of these as the run’s inputs.
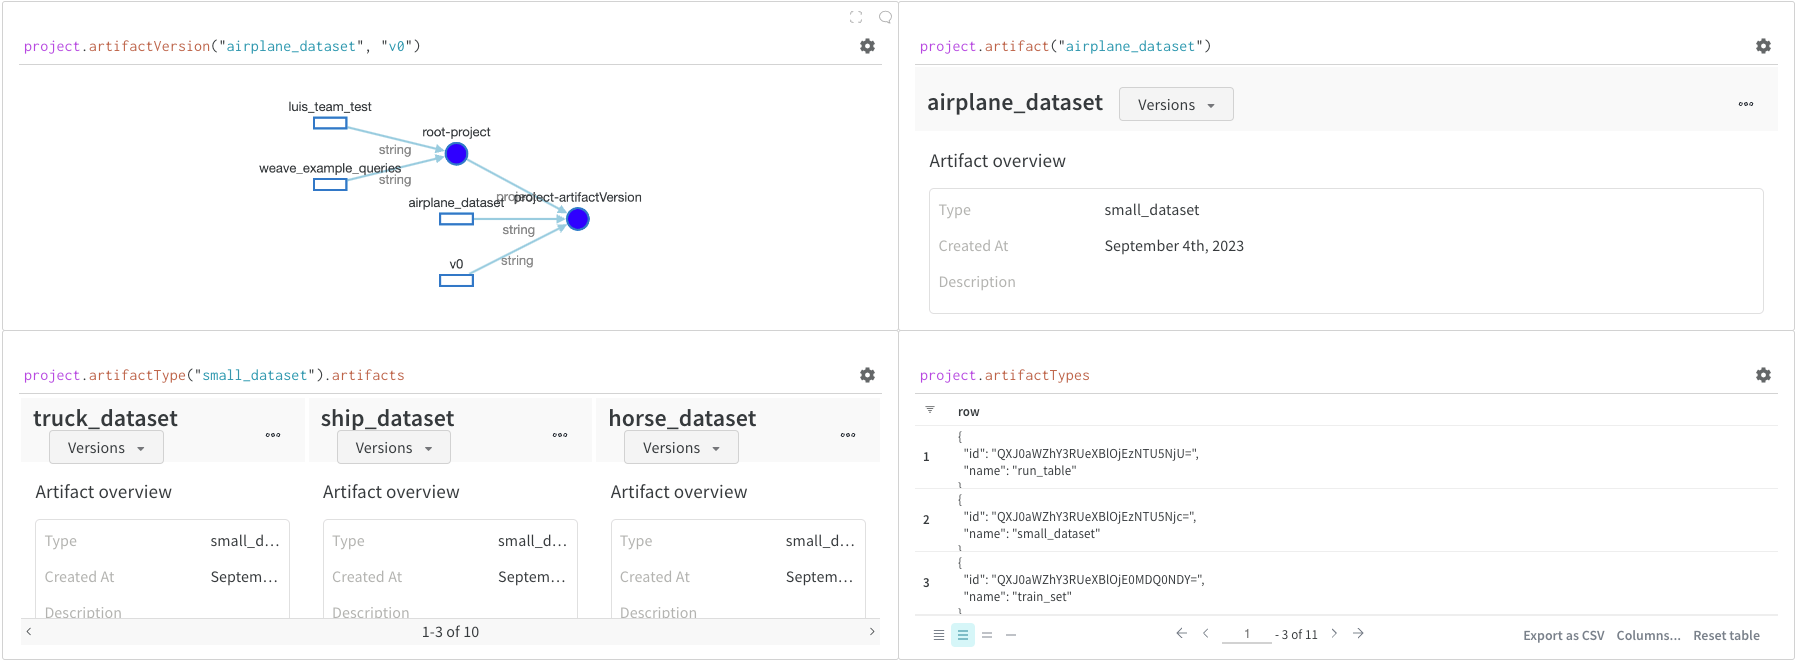
Access artifacts
Artifacts are a core concept in W&B. They are a versioned, named collection of files and directories. Use artifacts to track model weights, datasets, and any other file or directory. W&B stores artifacts, and you can download them or use them in other runs. For more details and examples, see Accessing artifacts. You normally access artifacts from theproject object:
project.artifactVersion(): Returns the specific artifact version for a given name and version within a project.project.artifact(""): Returns the artifact for a given name within a project. You can then use.versionsto get a list of all versions of this artifact.project.artifactType(): Returns theartifactTypefor a given name within a project. You can then use.artifactsto get a list of all artifacts with this type.project.artifactTypes: Returns a list of all artifact types under the project.