wandb.Run.log() when all logged values are of length one.
Customize bar plots
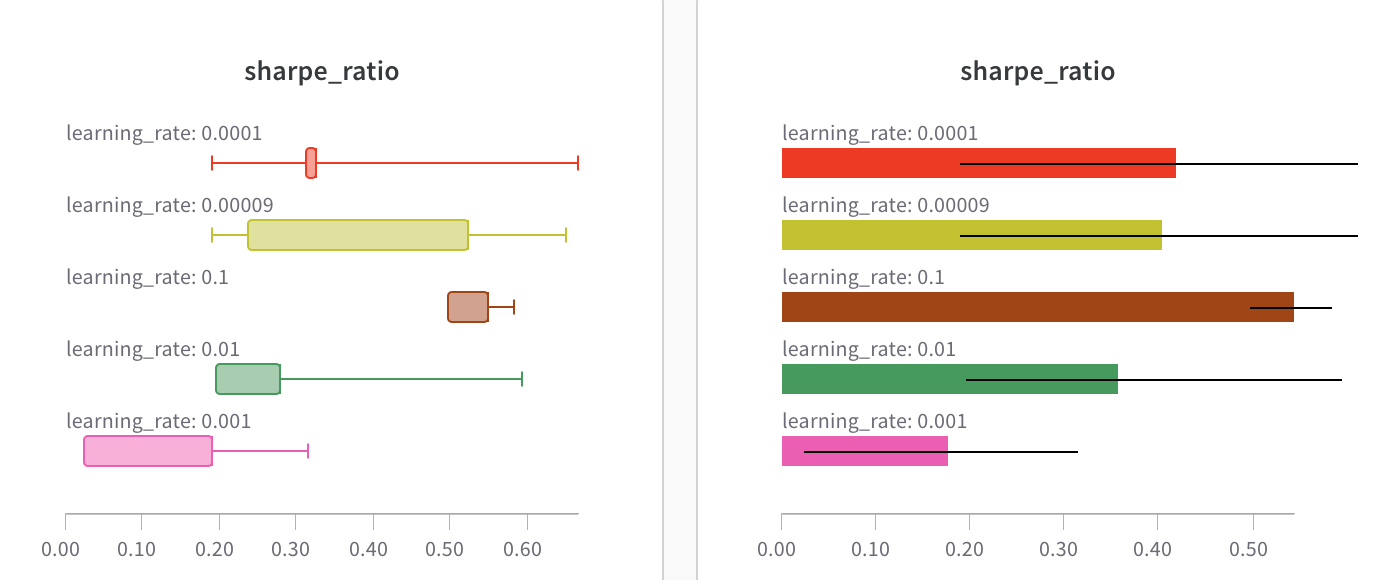
You can also create Box or Violin plots to combine many summary statistics into one chart type. To create a box or violin plot:- Group runs through the runs table.
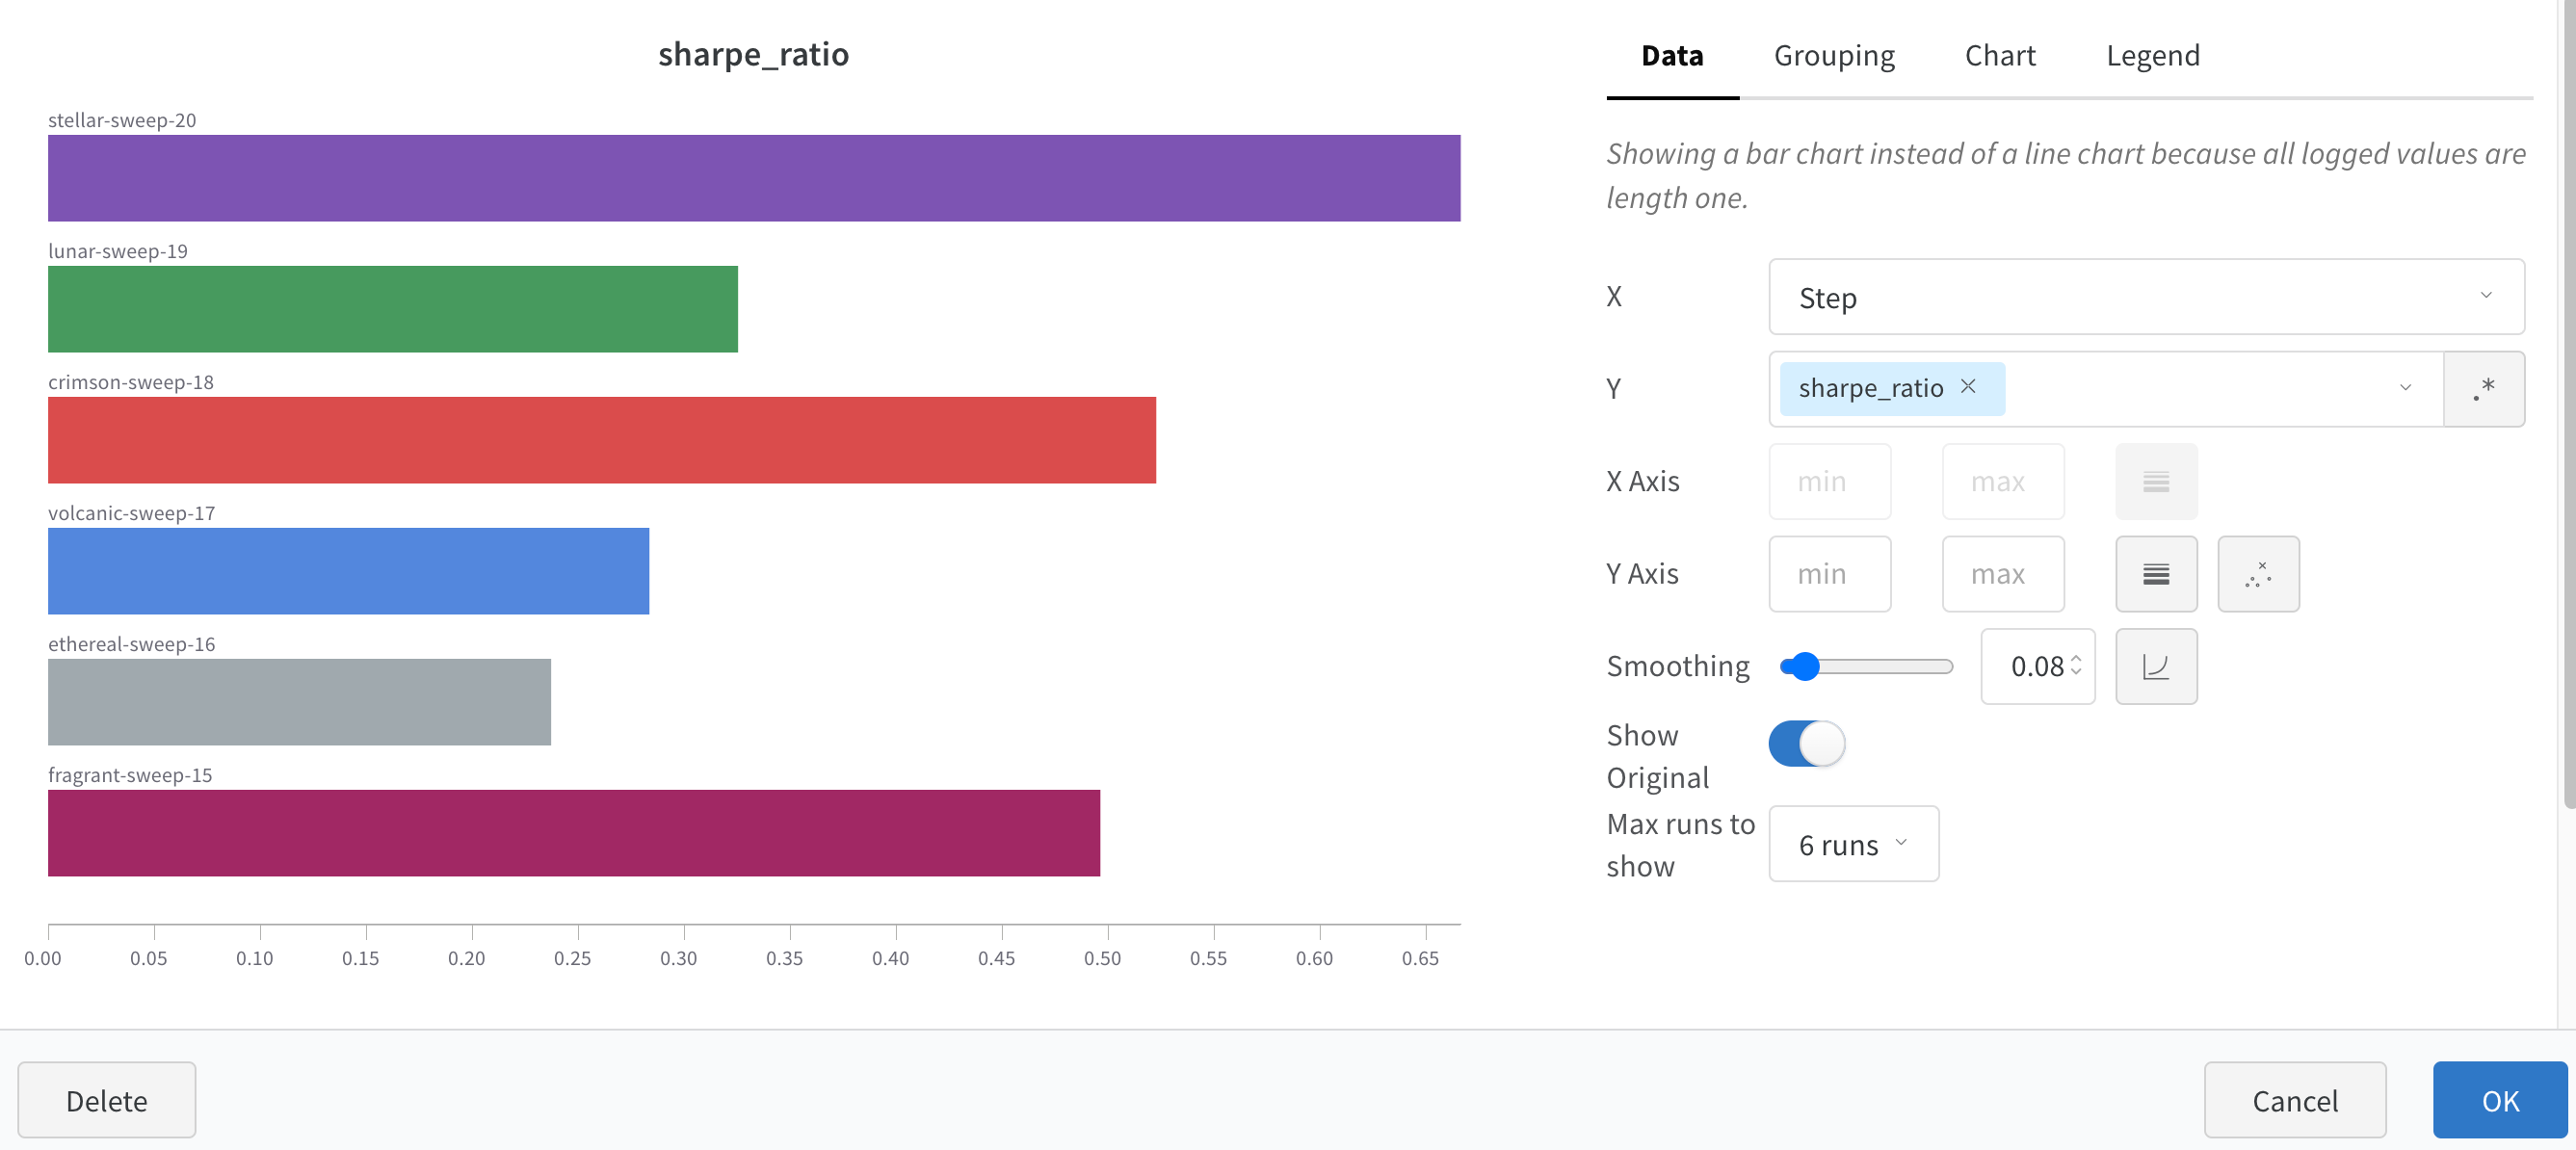
- In the workspace, click Add panel.
- Add a standard Bar Chart and select the metric to plot.
- Under the Grouping tab, pick Box or Violin to plot either of these styles.