wandb==0.12.11 and requires kfp<2.0.0
Sign up and create an API key
An API key authenticates your machine to W&B. You can generate an API key from your user profile.For a more streamlined approach, create an API key by going directly to User Settings. Copy the newly created API key immediately and save it in a secure location such as a password manager.
- Click your user profile icon in the upper right corner.
- Select User Settings, then scroll to the API Keys section.
Install the wandb library and log in
To install the wandb library locally and log in:
- Command Line
- Python
- Python notebook
-
Set the
WANDB_API_KEYenvironment variable to your API key. -
Install the
wandblibrary and log in.
Decorate your components
Add the@wandb_log decorator and create your components as usual. This will automatically log the input/outputs parameters and artifacts to W&B each time you run your pipeline.
Pass environment variables to containers
You may need to explicitly pass environment variables to your containers. For two-way linking, you should also set the environment variablesWANDB_KUBEFLOW_URL to the base URL of your Kubeflow Pipelines instance. For example, https://kubeflow.mysite.com.
Access your data programmatically
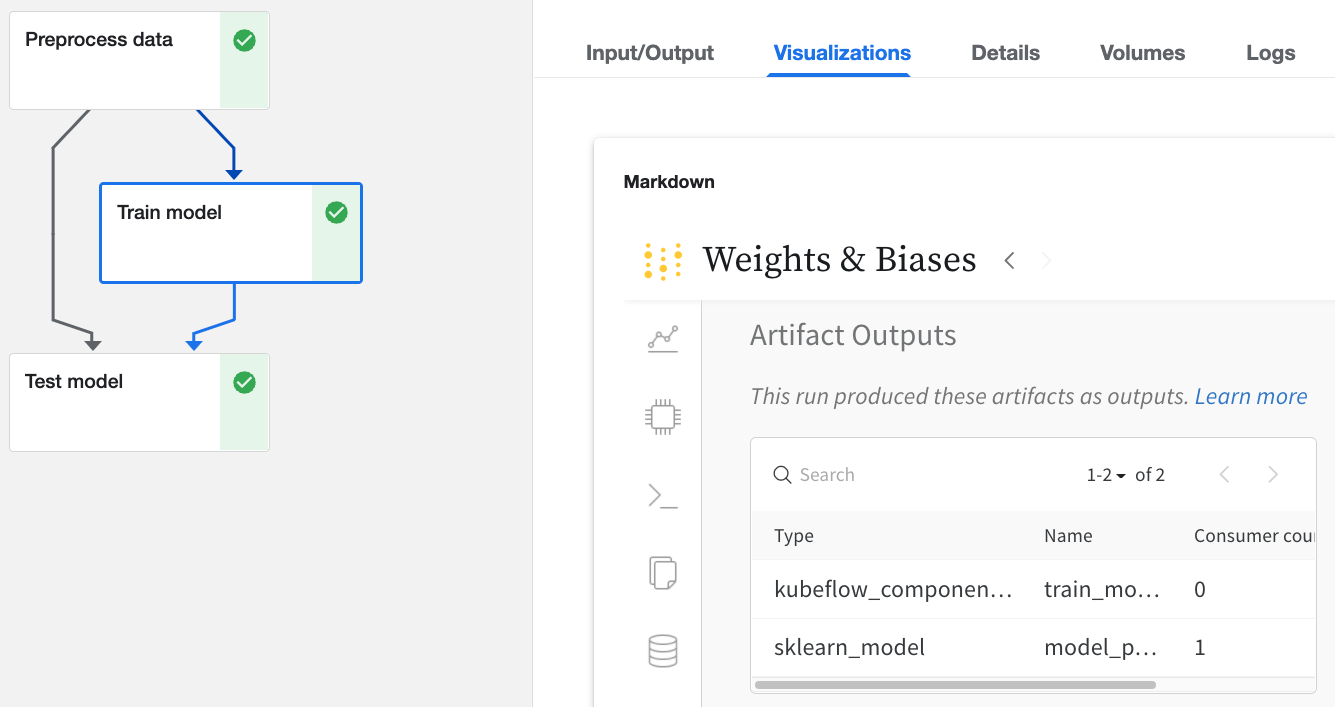
Via the Kubeflow Pipelines UI
Click on any Run in the Kubeflow Pipelines UI that has been logged with W&B.- Find details about inputs and outputs in the
Input/OutputandML Metadatatabs. - View the W&B web app from the
Visualizationstab.
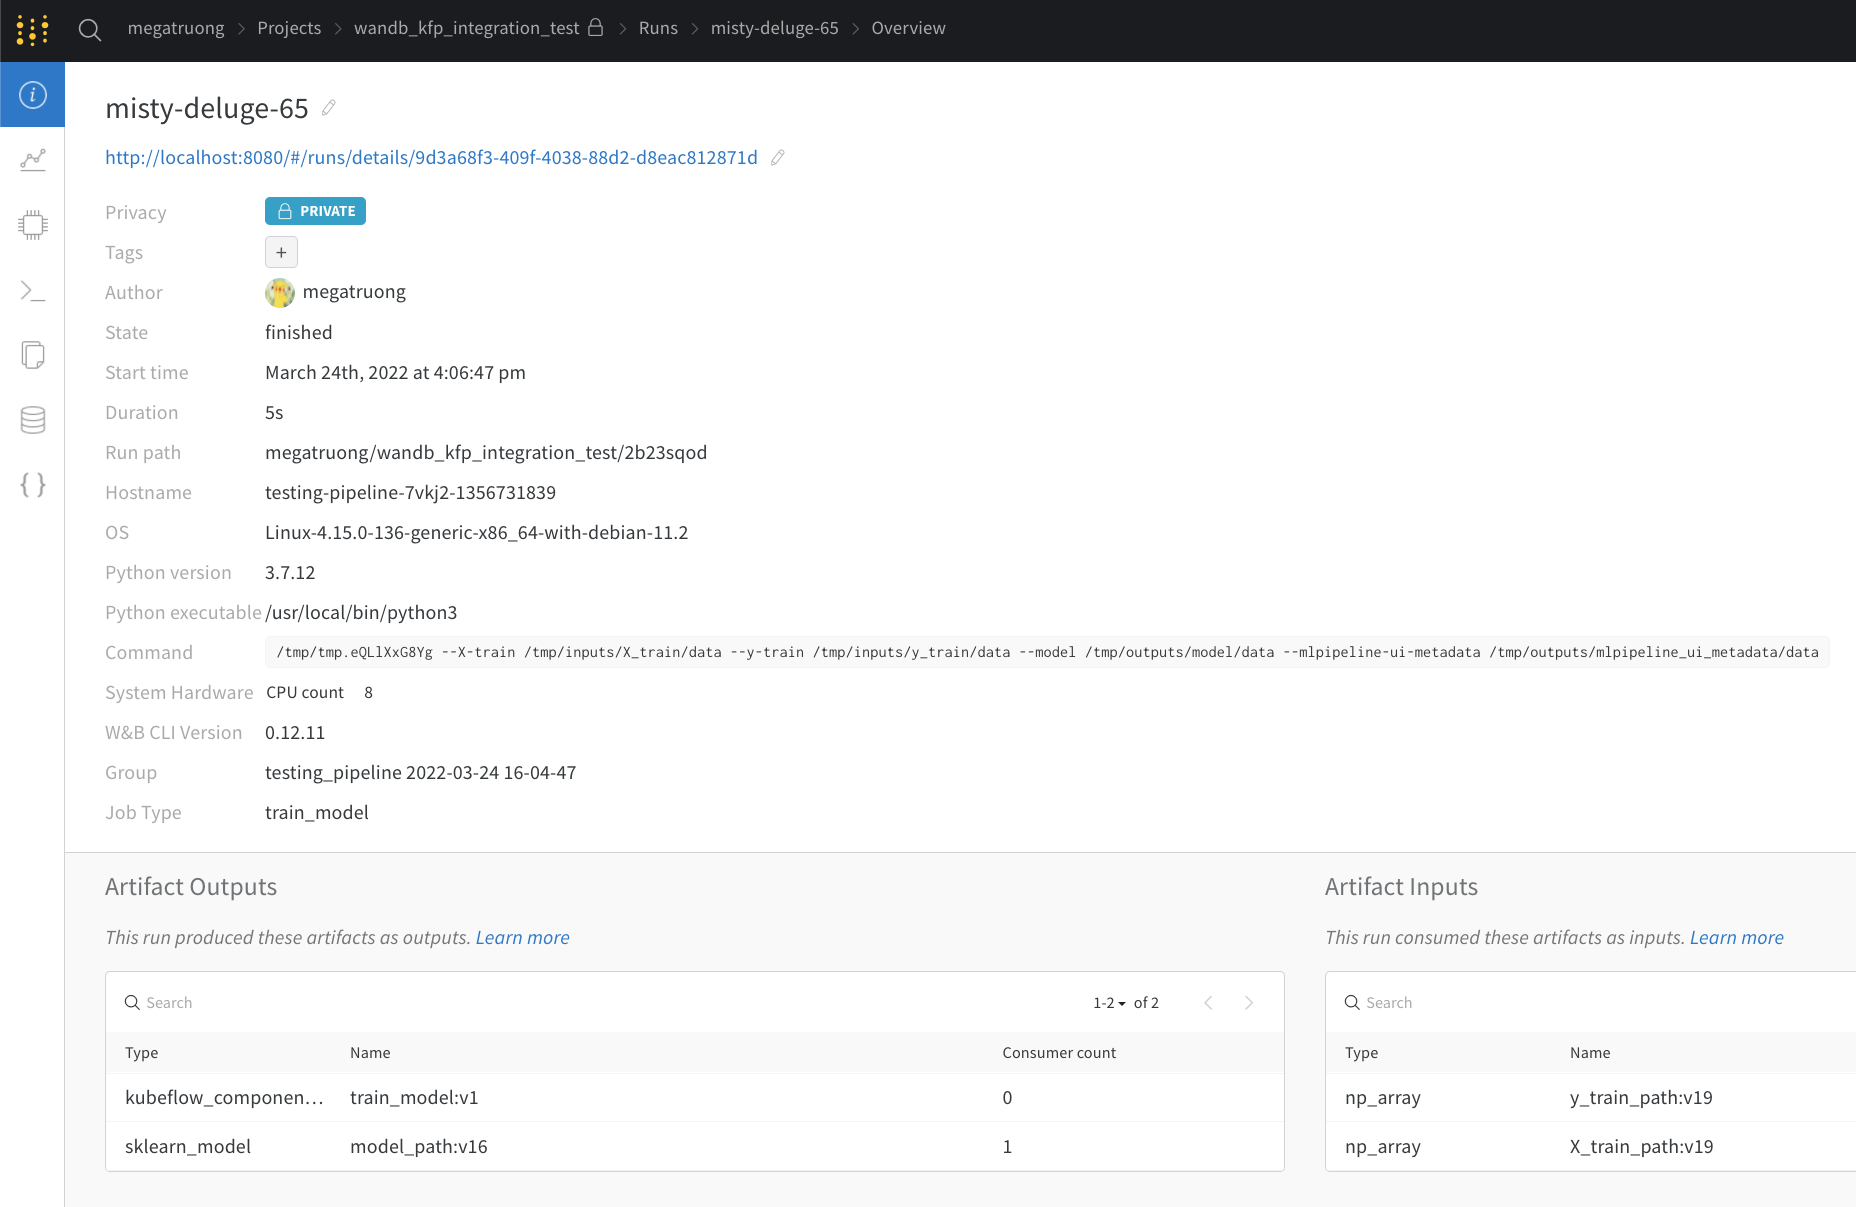
Via the web app UI
The web app UI has the same content as theVisualizations tab in Kubeflow Pipelines, but with more space. Learn more about the web app UI here.
Via the Public API (for programmatic access)
- For programmatic access, see our Public API.
Concept mapping from Kubeflow Pipelines to W&B
Here’s a mapping of Kubeflow Pipelines concepts to W&B| Kubeflow Pipelines | W&B | Location in W&B |
|---|---|---|
| Input Scalar | config | Overview tab |
| Output Scalar | summary | Overview tab |
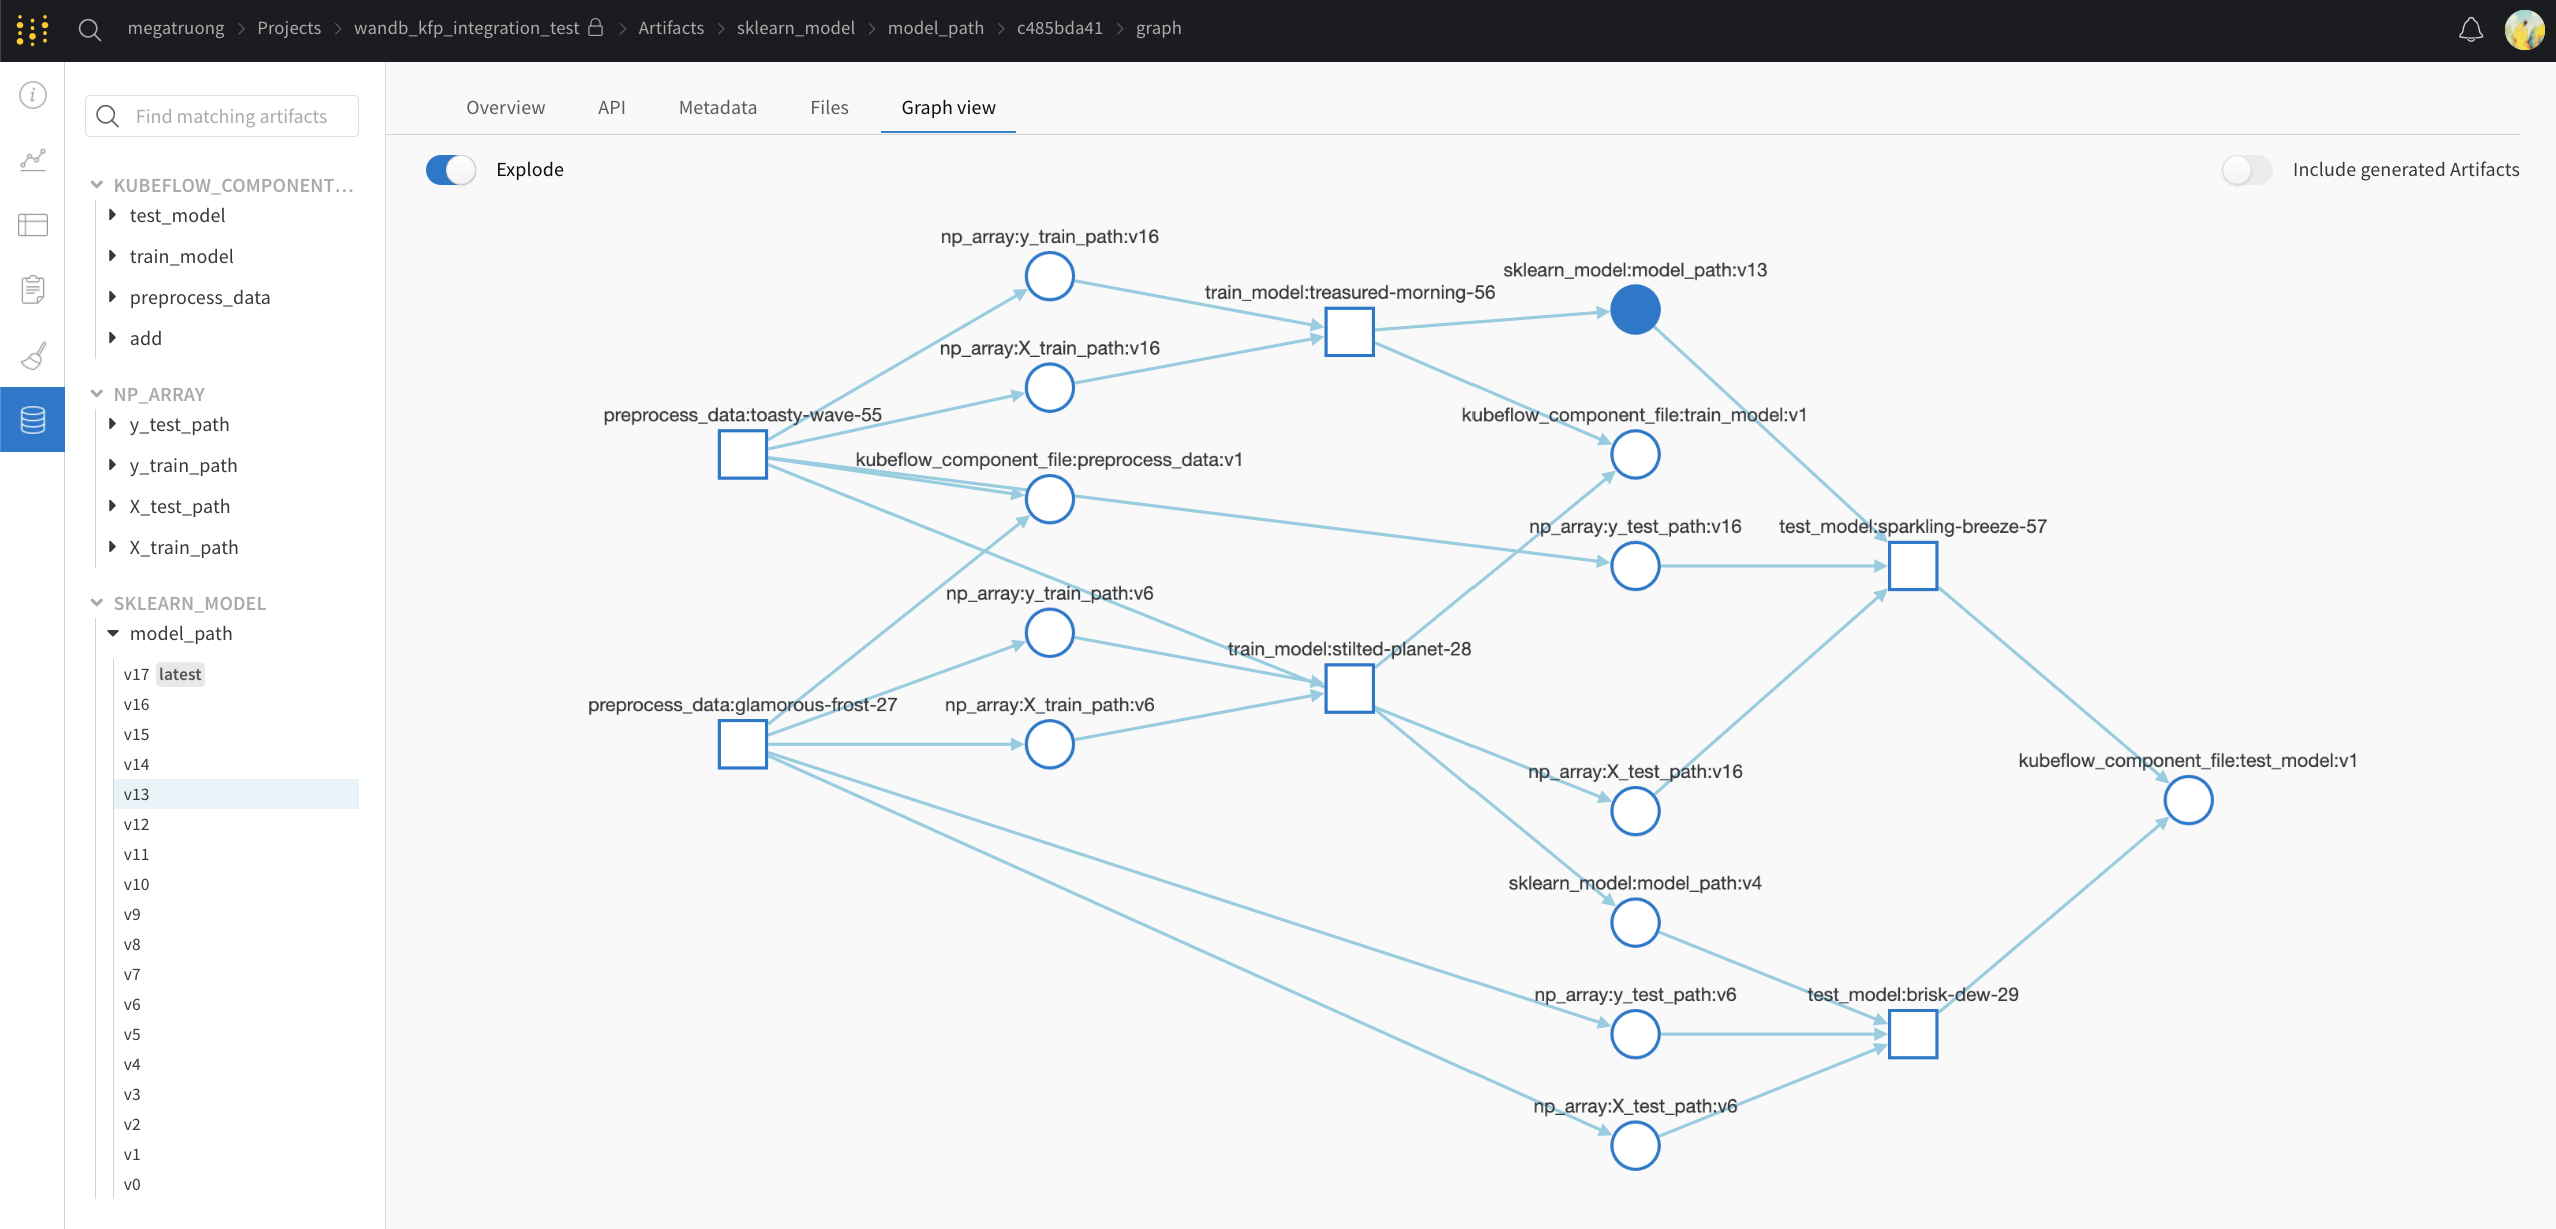
| Input Artifact | Input Artifact | Artifacts tab |
| Output Artifact | Output Artifact | Artifacts tab |
Fine-grain logging
If you want finer control of logging, you can sprinkle inwandb.log and wandb.log_artifact calls in the component.
With explicit wandb.log_artifacts calls
In this example below, we are training a model. The @wandb_log decorator will automatically track the relevant inputs and outputs. If you want to log the training process, you can explicitly add that logging like so: