> ## Documentation Index
> Fetch the complete documentation index at: https://docs.wandb.ai/llms.txt
> Use this file to discover all available pages before exploring further.
# Use Weave with W&B training runs
> Integrate Weave traces with W&B training runs to view function execution details alongside ML metrics in workspace dashboards.
# Log traces during model training runs
You can log Weave traces during model training runs and view them in your personal workspace.
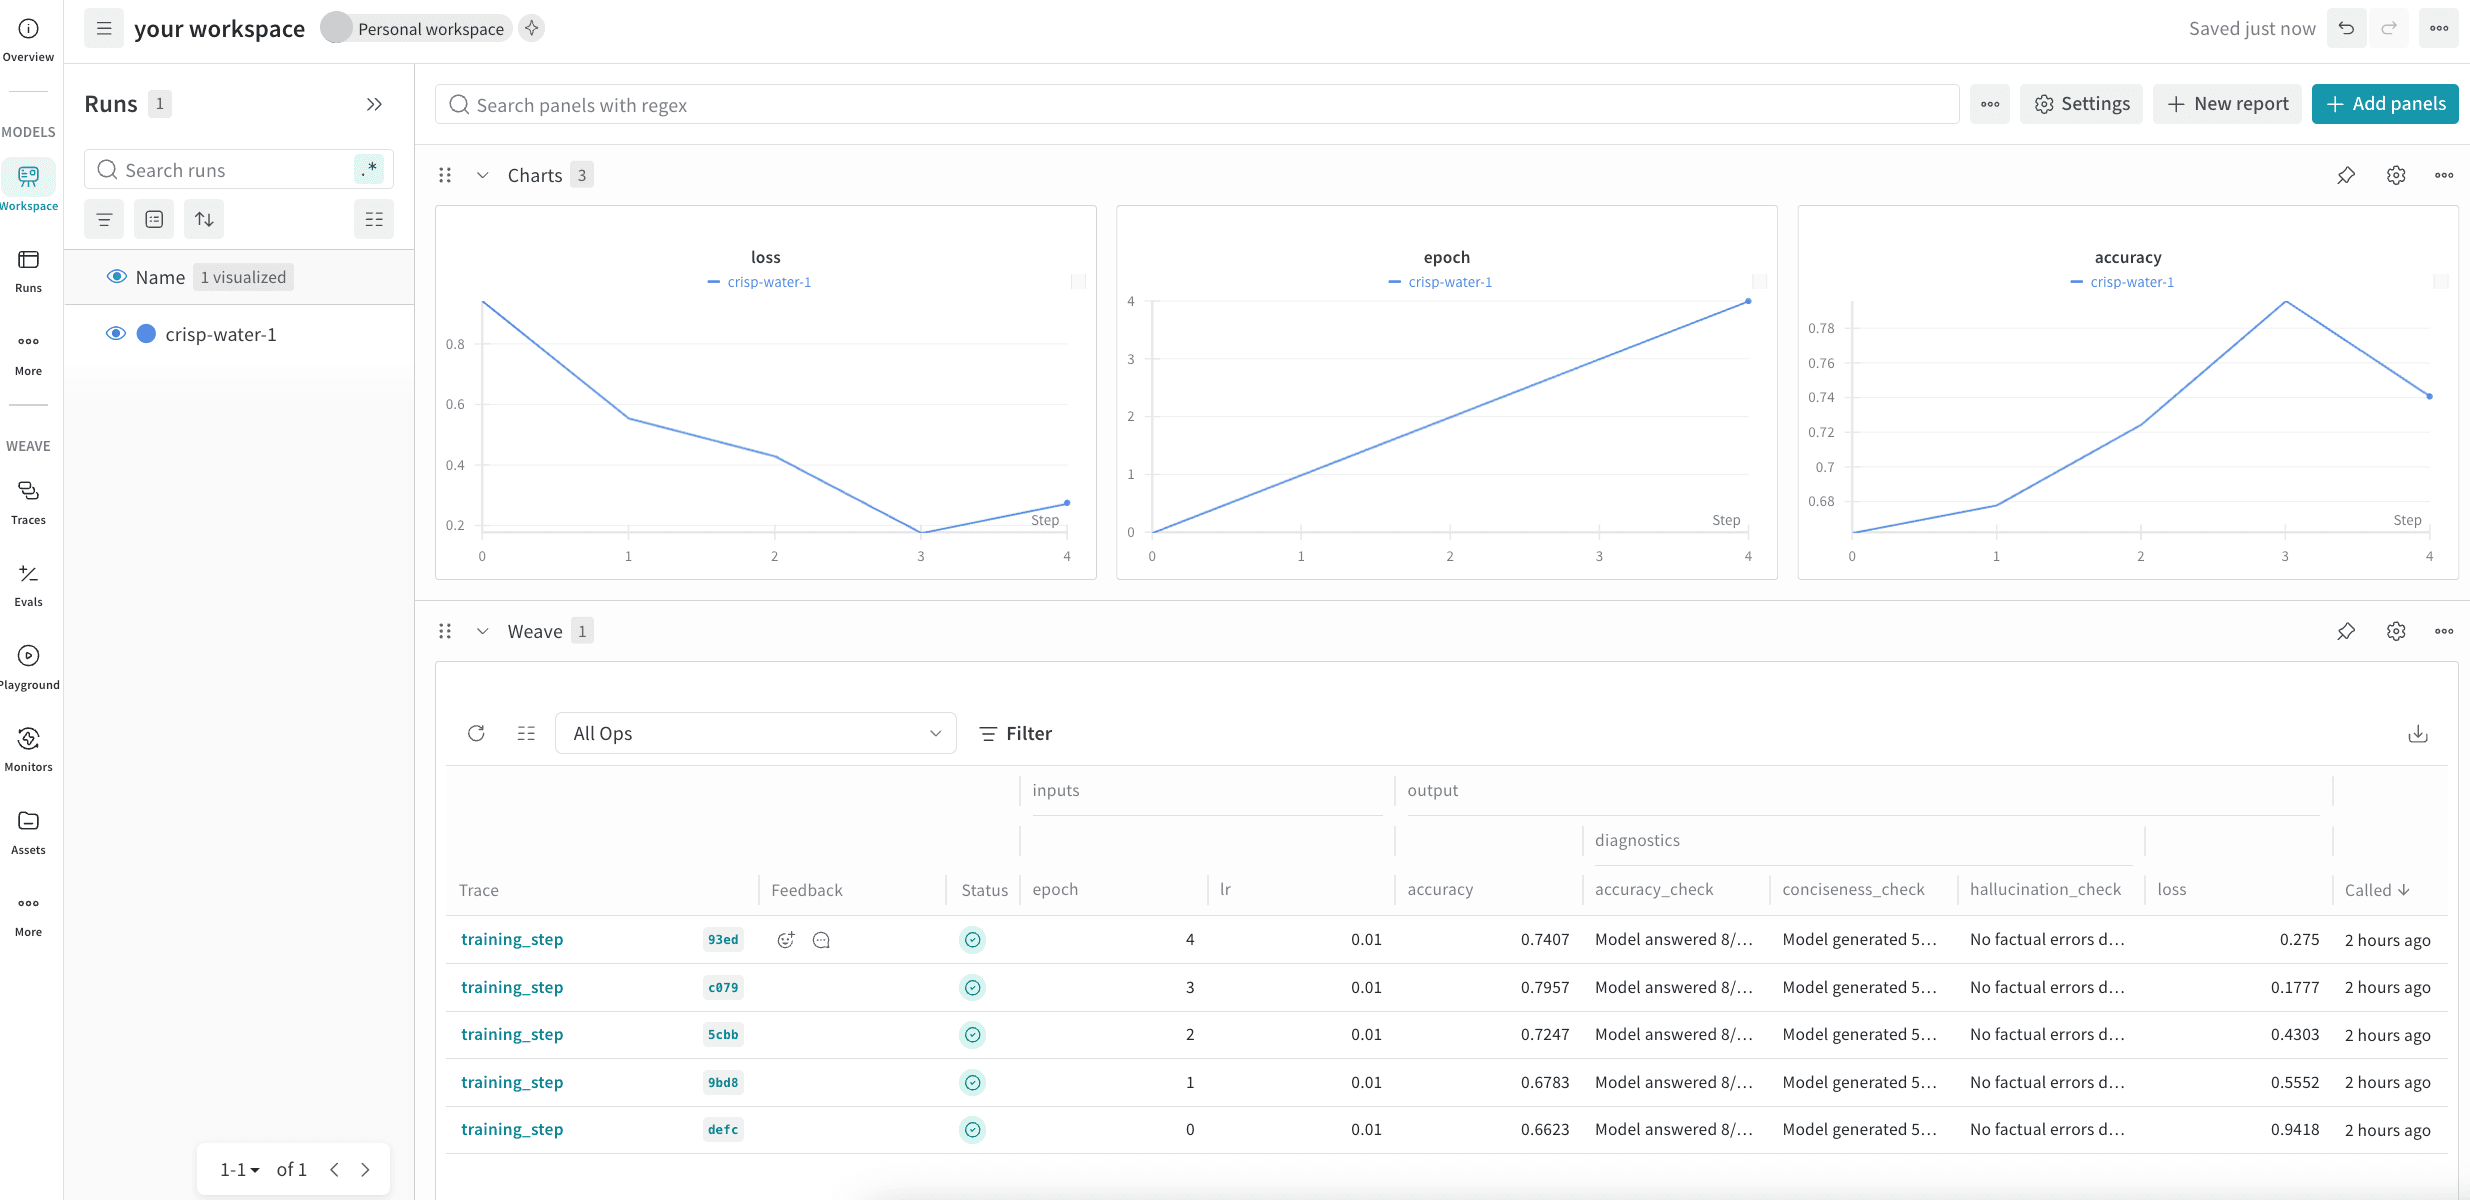 Personal workspaces are customizable dashboards in the UI that let you view in-depth analysis and data visualizations of your model training runs. When you add Weave panels to your workspace, you can view and access trace data logged during model runs to gain insight into how your models perform during training.
For example, if you're fine-tuning an LLM model and your W\&B workspace shows that accuracy drops at step 500, the integrated Weave traces can reveal exactly what happened. For instance, your model started generating overly verbose responses that failed the evaluation criteria.
## Use Weave panels
When you [decorate the functions with `@weave.op`](/weave/quickstart) in your ML pipelines, you automatically capture their execution information and access it in a personal workspace.
For example, the following script demonstrates how Weave traces integrate with W\&B training runs. It simulates a machine learning training loop where each training step logs metrics to W\&B while simultaneously creating detailed Weave traces. The `@weave.op` decorators on the functions automatically capture inputs, outputs, and execution details. When the training loop logs metrics with `wandb.log()`, it also logs Weave trace information to your project.
```python lines theme={null}
import wandb
import weave
import random
# Initialize both W&B and Weave with the same project
project = "my-workspace-project"
weave.init(project)
@weave.op
def evaluate_model(model_state, epoch):
# Simulate evaluation metrics
accuracy = 0.7 + epoch * 0.02 + random.uniform(-0.05, 0.05)
# Track specific model behaviors
test_responses = {
"conciseness_check": "Model generated 500 words for simple question",
"accuracy_check": "Model answered 8/10 questions correctly",
"hallucination_check": "No factual errors detected"
}
return {
"accuracy": accuracy,
"diagnostic_results": test_responses
}
@weave.op
def training_step(epoch, lr):
# Simulate Training logic
loss = 1.0 / (epoch + 1) + random.uniform(-0.1, 0.1)
# Evaluation with traces
eval_results = evaluate_model(f"checkpoint_{epoch}", epoch)
return {
"loss": loss,
"accuracy": eval_results["accuracy"],
"diagnostics": eval_results["diagnostic_results"]
}
# Training loop
with wandb.init(project=project, config={"lr": 0.01}) as run:
for epoch in range(5):
# Execute training with Weave tracing
results = training_step(epoch, run.config.lr)
# Log to W&B - creates the integration point
run.log({
"epoch": epoch,
"loss": results["loss"],
"accuracy": results["accuracy"]
})
```
You can run this example script to see how traces get logged with the rest of your run information.
After the run starts, you can view the trace information in your workspace either during or after the run. Open the link provided in the terminal at the start of a run (it looks like this: `wandb: 🚀 View run at https://wandb.ai/wandb/my-project/runs/[RUN-ID]`), or navigate to the workspace in the UI.
To navigate to a workspace from the UI:
1. Open the W\&B UI and click the **Projects** tab. This opens a list of your projects.
2. From the list of projects, click the project that you logged your run to. This opens the **Workspaces** page.
3. If you've set up your workspace as an automatic workspace, the workspace automatically populates with data visualizations and information about your run. The trace data for your run is under the **Weave** section of the workspace. If your workspace is a manual workspace, you can add Weave panels by clicking **Add panels** and selecting panels from the **Weave** section of the Add Panels menu.
For more information about workspaces, see [View experiments results](https://docs.wandb.ai/models/track/workspaces).
## Associate traces with a specific W\&B run
In some cases, you may want to attach traces to a run other than the one Weave detects automatically. By default, Weave automatically detects and associates traces with the active `wandb.run`. If you need to associate traces with a specific run that isn't the global `wandb.run`, use `set_wandb_run_context`. To associate traces with a specific run and run step, define values for the method's `run_id` and `step` arguments:
```python lines highlight={6} theme={null}
import weave
client = weave.init("[YOUR-TEAM-NAME]/[YOUR-PROJECT-NAME]")
# Associate all subsequent traces with a specific run.
client.set_wandb_run_context(run_id="[YOUR-RUN-ID]", step=[INTEGER])
@weave.op
def my_function(x):
return x * 2
my_function(10) # This trace is linked to "my-run-id" at step 5.
```
The `run_id` is the run's short ID (for example, `38m4t5ja`), not the full `entity/project/run_id` path. You can find a run's short ID in the run URL (`https://wandb.ai/team/project/runs/[RUN-ID]`) or by [accessing `wandb.run.id` in code](/models/runs/run-identifiers#find-and-customize-a-runs-id-or-name).
To stop the override and fall back to the global `wandb.run`, call `clear_wandb_run_context`:
```python lines theme={null}
client.clear_wandb_run_context()
my_function(20) # This trace uses the global wandb.run (if any).
```
## Reference W\&B artifacts in a Weave trace
You can reference [W\&B artifacts](/models/artifacts) (such as models, datasets, and checkpoints) in your Weave traces. This creates a clickable link in the Weave UI that navigates directly to the artifact's details page, which helps you track which artifact versions you used during specific operations.
For example, if you've trained two versions of a model (`v1` and `v2`), you can add the `v1` artifact reference as an attribute of the trace when you query that model. This helps you trace exactly which artifact version produced a given output.
To associate an artifact with a trace, construct the artifact's URL by concatenating the `wandb-artifact:///` prefix with the artifact's full name using the following syntax: `wandb-artifact:///[FULL-NAME-OF-ARTIFACT]`. Then pass it to Weave in one of two ways:
* As an arbitrary attribute
* As an attribute of a `Model`
You can locate the artifact's full name on its details page in the W\&B UI. It looks like this: `[ENTITY]/[PROJECT]/[ARTIFACT-NAME]:[VERSION]`. You can copy the full name from the artifact's details page in the W\&B UI.
The following sections show each approach.
### Add an artifact as an attribute of a trace
To add an artifact as an attribute of a trace, pass it as a key-value pair to the `weave.attributes()` context manager:
```python lines {10} theme={null}
import weave
weave.init("[YOUR-TEAM-NAME]/[YOUR-PROJECT-NAME]")
@weave.op
def my_function(name: str):
return f"Hello, {name}!"
# Add an arbitrary key-name and the artifact's URL as the value
with weave.attributes({'artifact_id': 'wandb-artifact:///team-name/project-name/run-38m4t5ja-history:v0'}):
result = my_function("World")
```
```typescript twoslash lines {12} theme={null}
// @noErrors
import {init, op, withAttributes} from 'weave';
async function main() {
await init('wandb/docs');
const myFunction = op(async function myFunction(name: string) {
return `Hello, ${name}!`;
});
// Add an arbitrary key-name and the artifact's URL as the value
const result = await withAttributes(
{artifact_id: "wandb-artifact:///team-name/project-name/run-38m4t5ja-history:v0"},
async () => myFunction('World')
);
console.log('Result:', result);
}
main().catch(console.error);
```
### Add an artifact as an attribute of a `Model`
To add an artifact as an attribute of a `Model`, pass the artifact URL when you instantiate the model:
The `Model` class is only supported in the Weave Python SDK.
```python lines {7,17} theme={null}
import weave
weave.init("[YOUR-TEAM-NAME]/[YOUR-PROJECT-NAME]")
class MyModel(weave.Model):
# Store the artifact reference as a model attribute
artifact_id: str
temperature: float = 0.7
@weave.op
def predict(self, query: str) -> str:
# Your model inference logic here
return f"Response to: {query}"
# Pass the artifact's URL as an attribute of the model
model = MyModel(
artifact_id="wandb-artifact:///team-name/project-name/run-38m4t5ja-history:v0"
)
result = model.predict("Hello, World!")
```
Personal workspaces are customizable dashboards in the UI that let you view in-depth analysis and data visualizations of your model training runs. When you add Weave panels to your workspace, you can view and access trace data logged during model runs to gain insight into how your models perform during training.
For example, if you're fine-tuning an LLM model and your W\&B workspace shows that accuracy drops at step 500, the integrated Weave traces can reveal exactly what happened. For instance, your model started generating overly verbose responses that failed the evaluation criteria.
## Use Weave panels
When you [decorate the functions with `@weave.op`](/weave/quickstart) in your ML pipelines, you automatically capture their execution information and access it in a personal workspace.
For example, the following script demonstrates how Weave traces integrate with W\&B training runs. It simulates a machine learning training loop where each training step logs metrics to W\&B while simultaneously creating detailed Weave traces. The `@weave.op` decorators on the functions automatically capture inputs, outputs, and execution details. When the training loop logs metrics with `wandb.log()`, it also logs Weave trace information to your project.
```python lines theme={null}
import wandb
import weave
import random
# Initialize both W&B and Weave with the same project
project = "my-workspace-project"
weave.init(project)
@weave.op
def evaluate_model(model_state, epoch):
# Simulate evaluation metrics
accuracy = 0.7 + epoch * 0.02 + random.uniform(-0.05, 0.05)
# Track specific model behaviors
test_responses = {
"conciseness_check": "Model generated 500 words for simple question",
"accuracy_check": "Model answered 8/10 questions correctly",
"hallucination_check": "No factual errors detected"
}
return {
"accuracy": accuracy,
"diagnostic_results": test_responses
}
@weave.op
def training_step(epoch, lr):
# Simulate Training logic
loss = 1.0 / (epoch + 1) + random.uniform(-0.1, 0.1)
# Evaluation with traces
eval_results = evaluate_model(f"checkpoint_{epoch}", epoch)
return {
"loss": loss,
"accuracy": eval_results["accuracy"],
"diagnostics": eval_results["diagnostic_results"]
}
# Training loop
with wandb.init(project=project, config={"lr": 0.01}) as run:
for epoch in range(5):
# Execute training with Weave tracing
results = training_step(epoch, run.config.lr)
# Log to W&B - creates the integration point
run.log({
"epoch": epoch,
"loss": results["loss"],
"accuracy": results["accuracy"]
})
```
You can run this example script to see how traces get logged with the rest of your run information.
After the run starts, you can view the trace information in your workspace either during or after the run. Open the link provided in the terminal at the start of a run (it looks like this: `wandb: 🚀 View run at https://wandb.ai/wandb/my-project/runs/[RUN-ID]`), or navigate to the workspace in the UI.
To navigate to a workspace from the UI:
1. Open the W\&B UI and click the **Projects** tab. This opens a list of your projects.
2. From the list of projects, click the project that you logged your run to. This opens the **Workspaces** page.
3. If you've set up your workspace as an automatic workspace, the workspace automatically populates with data visualizations and information about your run. The trace data for your run is under the **Weave** section of the workspace. If your workspace is a manual workspace, you can add Weave panels by clicking **Add panels** and selecting panels from the **Weave** section of the Add Panels menu.
For more information about workspaces, see [View experiments results](https://docs.wandb.ai/models/track/workspaces).
## Associate traces with a specific W\&B run
In some cases, you may want to attach traces to a run other than the one Weave detects automatically. By default, Weave automatically detects and associates traces with the active `wandb.run`. If you need to associate traces with a specific run that isn't the global `wandb.run`, use `set_wandb_run_context`. To associate traces with a specific run and run step, define values for the method's `run_id` and `step` arguments:
```python lines highlight={6} theme={null}
import weave
client = weave.init("[YOUR-TEAM-NAME]/[YOUR-PROJECT-NAME]")
# Associate all subsequent traces with a specific run.
client.set_wandb_run_context(run_id="[YOUR-RUN-ID]", step=[INTEGER])
@weave.op
def my_function(x):
return x * 2
my_function(10) # This trace is linked to "my-run-id" at step 5.
```
The `run_id` is the run's short ID (for example, `38m4t5ja`), not the full `entity/project/run_id` path. You can find a run's short ID in the run URL (`https://wandb.ai/team/project/runs/[RUN-ID]`) or by [accessing `wandb.run.id` in code](/models/runs/run-identifiers#find-and-customize-a-runs-id-or-name).
To stop the override and fall back to the global `wandb.run`, call `clear_wandb_run_context`:
```python lines theme={null}
client.clear_wandb_run_context()
my_function(20) # This trace uses the global wandb.run (if any).
```
## Reference W\&B artifacts in a Weave trace
You can reference [W\&B artifacts](/models/artifacts) (such as models, datasets, and checkpoints) in your Weave traces. This creates a clickable link in the Weave UI that navigates directly to the artifact's details page, which helps you track which artifact versions you used during specific operations.
For example, if you've trained two versions of a model (`v1` and `v2`), you can add the `v1` artifact reference as an attribute of the trace when you query that model. This helps you trace exactly which artifact version produced a given output.
To associate an artifact with a trace, construct the artifact's URL by concatenating the `wandb-artifact:///` prefix with the artifact's full name using the following syntax: `wandb-artifact:///[FULL-NAME-OF-ARTIFACT]`. Then pass it to Weave in one of two ways:
* As an arbitrary attribute
* As an attribute of a `Model`
You can locate the artifact's full name on its details page in the W\&B UI. It looks like this: `[ENTITY]/[PROJECT]/[ARTIFACT-NAME]:[VERSION]`. You can copy the full name from the artifact's details page in the W\&B UI.
The following sections show each approach.
### Add an artifact as an attribute of a trace
To add an artifact as an attribute of a trace, pass it as a key-value pair to the `weave.attributes()` context manager:
```python lines {10} theme={null}
import weave
weave.init("[YOUR-TEAM-NAME]/[YOUR-PROJECT-NAME]")
@weave.op
def my_function(name: str):
return f"Hello, {name}!"
# Add an arbitrary key-name and the artifact's URL as the value
with weave.attributes({'artifact_id': 'wandb-artifact:///team-name/project-name/run-38m4t5ja-history:v0'}):
result = my_function("World")
```
```typescript twoslash lines {12} theme={null}
// @noErrors
import {init, op, withAttributes} from 'weave';
async function main() {
await init('wandb/docs');
const myFunction = op(async function myFunction(name: string) {
return `Hello, ${name}!`;
});
// Add an arbitrary key-name and the artifact's URL as the value
const result = await withAttributes(
{artifact_id: "wandb-artifact:///team-name/project-name/run-38m4t5ja-history:v0"},
async () => myFunction('World')
);
console.log('Result:', result);
}
main().catch(console.error);
```
### Add an artifact as an attribute of a `Model`
To add an artifact as an attribute of a `Model`, pass the artifact URL when you instantiate the model:
The `Model` class is only supported in the Weave Python SDK.
```python lines {7,17} theme={null}
import weave
weave.init("[YOUR-TEAM-NAME]/[YOUR-PROJECT-NAME]")
class MyModel(weave.Model):
# Store the artifact reference as a model attribute
artifact_id: str
temperature: float = 0.7
@weave.op
def predict(self, query: str) -> str:
# Your model inference logic here
return f"Response to: {query}"
# Pass the artifact's URL as an attribute of the model
model = MyModel(
artifact_id="wandb-artifact:///team-name/project-name/run-38m4t5ja-history:v0"
)
result = model.predict("Hello, World!")
```