> ## Documentation Index
> Fetch the complete documentation index at: https://docs.wandb.ai/llms.txt
> Use this file to discover all available pages before exploring further.
> View plan details, monitor usage, and configure usage and spending alerts for your W&B organization's billing.
# Manage billing settings
The **Billing** settings page lets organization and billing admins review the current plan, monitor usage, configure usage and spending alerts, manage payment methods, and access invoices. Use this page to keep your organization within its usage limits and to stay informed about upcoming charges.
To open billing settings:
1. In the top right corner, click your user icon.
2. From the dropdown, choose **Billing**, or choose **Settings** and then select the **Billing** tab.
## Plan details
The **Plan details** section summarizes your organization's current plan, charges, limits, and usage. From here, you can compare plans or talk to Sales.
From the **Plan details** section, you can take the following actions:
* For details and a list of users, click **Manage users**.
* For details about usage, click **View usage**.
* To view the amount of storage your organization uses, both free and paid, see the storage summary. From here, you can purchase additional storage and manage storage that is in use. Learn more about [storage settings](/platform/app/settings-page/storage/).
## Plan usage
The **Plan usage** section visually summarizes current usage and displays upcoming usage charges. For detailed insights into usage by month, click **View usage** on an individual tile. To export usage by calendar month, team, or project, click **Export CSV**. To explore usage trends over time, see [View usage over time](#view-usage-over-time).
For questions about usage or billing, contact your AISE or [Support](mailto:support@wandb.com).
### View usage over time
Organization admins can visualize usage trends for each category in the **Usage & Alerts** tab. Select your deployment type for instructions:
1. In the top right corner, click your user profile icon.
2. In the **Account** section, click **Usage & Alerts**.
3. From the sidebar, select a category to display its **Usage over time** chart.
1. In the top right corner, click your user profile icon.
2. Click **Organization Dashboard**.
3. Click **Usage & Alerts**.
4. From the sidebar, select a category to display its **Usage over time** chart.
Usage charts are visible to organization admins only. Team admins can't view them.
The categories in the sidebar depend on which products are active in your deployment, and can include **Storage**, **Tracked Hours**, **Weave**, **Inference**, **Training**, **AI Research Agent** (ARIA), and **Sandboxes**.
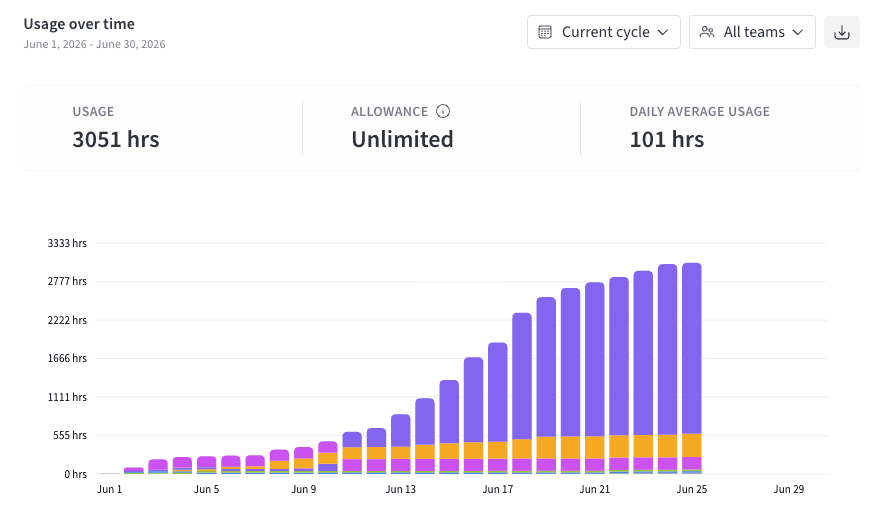 Use the controls above the chart to change what it shows:
* **Time range**: Choose **Current cycle** (the default for most categories), **Last 30 days**, **Last 90 days**, **Last 12 months**, or **Last 24 months**. Storage defaults to **Last 12 months**.
* **Team**: Choose **All teams** to see organization-wide usage, or select an individual team to see only its usage. The searchable dropdown lists teams from highest to lowest usage.
Each bar is segmented by team. The five teams with the highest usage across the selected time range each appear in their own color, and all remaining teams are grouped into **Other**. To see per-team usage, hover over a bar. The bar for the current period is marked as in progress.
To export usage data, click the download icon in the top right corner of the chart. The export returns a monthly usage breakdown by team and project for the last 24 months, regardless of the selected time range.
#### Current cycle compared to historical views
The **Current cycle** view is *cumulative*: each bar adds to the previous one to show your running total usage since the start of the current billing period. Use this view to see how your usage is pacing against its allowance. Granularity depends on the length of your billing cycle. For example, a monthly cycle shows daily bars and an annual cycle shows monthly bars.
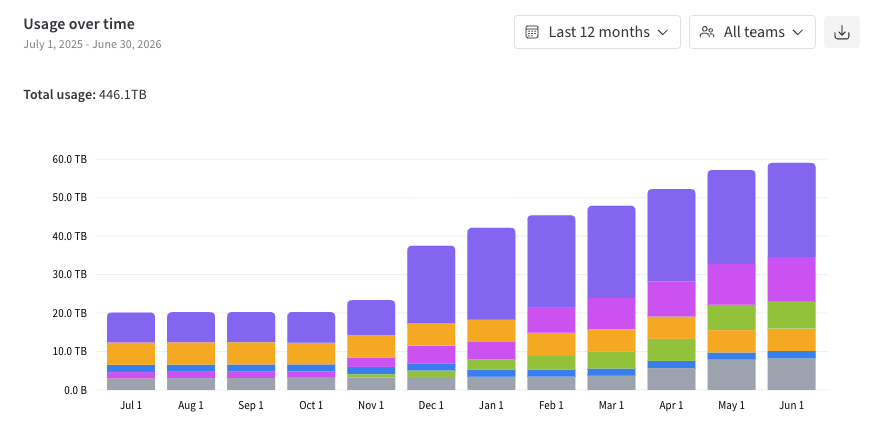
The **Last 30 days**, **Last 90 days**, **Last 12 months**, and **Last 24 months** views are *historical*: each bar shows the usage for a single day or month rather than a running total. Use these views to compare usage across past periods. Because the top five teams are recalculated for the selected range, the colored teams can differ from those in the current cycle.
Storage is always cumulative, because it measures the total volume currently stored (a 30-day weighted average, in GB) rather than usage consumed during a period.
Use the controls above the chart to change what it shows:
* **Time range**: Choose **Current cycle** (the default for most categories), **Last 30 days**, **Last 90 days**, **Last 12 months**, or **Last 24 months**. Storage defaults to **Last 12 months**.
* **Team**: Choose **All teams** to see organization-wide usage, or select an individual team to see only its usage. The searchable dropdown lists teams from highest to lowest usage.
Each bar is segmented by team. The five teams with the highest usage across the selected time range each appear in their own color, and all remaining teams are grouped into **Other**. To see per-team usage, hover over a bar. The bar for the current period is marked as in progress.
To export usage data, click the download icon in the top right corner of the chart. The export returns a monthly usage breakdown by team and project for the last 24 months, regardless of the selected time range.
#### Current cycle compared to historical views
The **Current cycle** view is *cumulative*: each bar adds to the previous one to show your running total usage since the start of the current billing period. Use this view to see how your usage is pacing against its allowance. Granularity depends on the length of your billing cycle. For example, a monthly cycle shows daily bars and an annual cycle shows monthly bars.
The **Last 30 days**, **Last 90 days**, **Last 12 months**, and **Last 24 months** views are *historical*: each bar shows the usage for a single day or month rather than a running total. Use these views to compare usage across past periods. Because the top five teams are recalculated for the selected range, the colored teams can differ from those in the current cycle.
Storage is always cumulative, because it measures the total volume currently stored (a 30-day weighted average, in GB) rather than usage consumed during a period.
 #### Stats bar and threshold lines
When both **Current cycle** and **All teams** are selected, a stats bar above the chart summarizes **Usage**, **Allowance**, and **Daily Average Usage**. Storage charts do not display a stats bar or daily average usage; instead, historical views show the aggregated total usage for that specific time range.
When a category has a defined allowance, the chart displays two threshold lines: a gold line at 85% of the allowance and a red line at 100%. These lines mark where [usage alerts](#usage-alerts) are sent to admins. Usage can exceed these thresholds. The lines are visual guides only.
#### Stats bar and threshold lines
When both **Current cycle** and **All teams** are selected, a stats bar above the chart summarizes **Usage**, **Allowance**, and **Daily Average Usage**. Storage charts do not display a stats bar or daily average usage; instead, historical views show the aggregated total usage for that specific time range.
When a category has a defined allowance, the chart displays two threshold lines: a gold line at 85% of the allowance and a red line at 100%. These lines mark where [usage alerts](#usage-alerts) are sent to admins. Usage can exceed these thresholds. The lines are visual guides only.
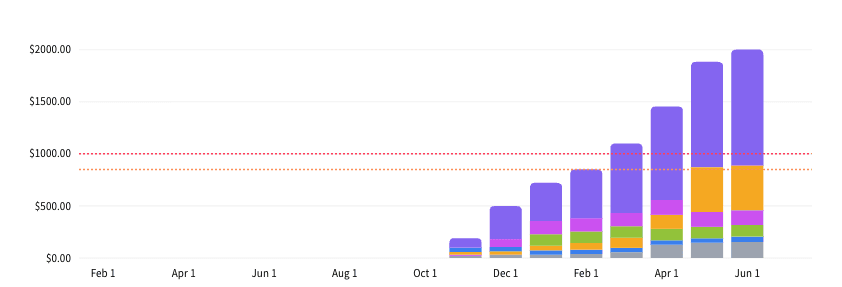 For categories with no usage limit, **Allowance** displays as **Unlimited** and no threshold lines appear.
### View and manage usage Alerts
Usage alerts notify organization and billing admins by email when your organization reaches 85% and 100% of its usage limit for the current billing period in a given category. Configure usage alerts to monitor consumption and avoid unexpected overages. Usage alerts are available for the following categories:
| Category | Description |
| --------- | ----------------------------------------------------------------------------------------------------------------------------------------------------------------------------------------------------- |
| Storage | Total accumulated volume of your organization's stored artifacts and run data, measured in GB. |
| Weave | Total volume of data imported during the billing period, measured in MB. Shown only if Weave is active in the deployment. |
| Inference | Total input and output tokens used by Inference. See [Inference Pricing](https://wandb.ai/site/pricing/inference/). Shown only if Inference is active in the deployment. |
| Training | Token-based inference and compute, measured in GPU/hour. See [Serverless RL Pricing](https://wandb.ai/site/pricing/reinforcement-learning/). Shown only if Serverless RL is active in the deployment. |
| Sandboxes | Flat rate per billing period, determined by your plan. See [Pricing](https://wandb.ai/site/pricing/). Shown only if Sandboxes are active in the deployment. |
Usage alerts are not available for categories with no usage limit like tracked hours, or during a trial.
For organizations on the **Enterprise** plan, all **Organization admins** and **Billing admins** receive and can configure usage alerts. On the [Pro plan](https://wandb.ai/site/pricing/), only the **Billing admin** receives usage alerts.
Messages are sent from `support@wandb.com`. The thresholds are not configurable, but you can selectively turn off one or both alerts per category.
To configure usage alerts for your organization, you must be an **Organization admin** or **Billing admin**.
1. In the top right corner, click your user profile icon.
2. In the **Account** section, click **Usage & Alerts**. Alternatively, click **Settings**, then click the **Usage & Alerts** tab.
3. From the sidebar, select a category.
4. Click the **Usage** tab to view your organization's usage and alert settings for that category.
5. Turn on or off the **85% usage alert** or **100% usage alert** for that category. With no active usage alerts for a category, your organization could reach 100% of usage in a category without warning.
### View and manage spending Alerts
In a given billing period, spending alerts notify organization and billing admins by email when your organization reaches one or more customizable spending thresholds expressed in USD. Use spending alerts to track costs against a budget you define. You can configure up to five unique spending alerts per category:
| Category | Description |
| --------- | -------------------------------------------------------------------------------------------------------------------------------------------------------------------------------------------------------------------------------------------- |
| Storage | Charges for your organization's storage [usage](#usage-alerts) during the billing period. See [Pricing](https://wandb.ai/site/pricing/). |
| Weave | Charges for your organization's Weave [usage](#usage-alerts) during the billing period. See [Pricing](https://wandb.ai/site/pricing/). Shown only if Weave is active in the deployment. |
| Inference | Charges for your organization's Inference [usage](#usage-alerts) during the billing period. See [Inference Pricing](https://wandb.ai/site/pricing/inference/). Shown only if Inference is active in the deployment. |
| Training | Charges for your organization's Serverless RL [usage](#usage-alerts) during the billing period. See [Serverless RL Pricing](https://wandb.ai/site/pricing/reinforcement-learning/). Shown only if Serverless RL is active in the deployment. |
| Sandboxes | Flat rate per billing period, determined by your plan. See [Pricing](https://wandb.ai/site/pricing/). Shown only if Sandboxes are active in the deployment. |
* Spending alerts are not available for categories with no spending limit or during a trial.
* You aren't billed for tracked hours, which are unlimited for all plans.
Messages are sent from `support@wandb.com`.
On the **Enterprise** plan:
* All **Organization admins** and **Billing admins** receive spending alerts.
* No spending alerts are configured by default.
On the Pro plan:
* Only the **Billing admin** receives spending alerts.
* By default, spending alerts are configured at $200, $450, $700, and $1,000.
To view and manage your organization's spending alerts:
1. In the top right corner, click your user profile icon.
2. In the **Account** section, click **Usage & Alerts**. Alternatively, click **Settings**, then click the **Usage & Alerts** tab.
3. From the sidebar, select a category.
4. Initially, the **Usage** tab displays. To view spending alerts, click **Spend alerts**. All configured spending alerts for the category display.
5. To add an alert, click **Add alert**.
a. Enter a threshold amount in USD.
a. Click **Create alert**.
6. To delete a spending alert, click the trash icon next to it.
## Payment methods
The **Payment methods** section shows the payment methods on file for your organization. If you haven't added a payment method, you're prompted to do so when you upgrade your plan or add paid storage.
## Billing admin
The **Billing admin** section shows the current billing admin. The billing admin is an organization admin, receives all billing-related emails, and can view and manage payment methods.
In W\&B Dedicated Cloud, multiple users can be billing admins. In W\&B Multi-tenant Cloud, only one user at a time can be the billing admin.
To change the billing admin or assign the role to additional users:
1. Click **Manage roles**.
2. Search for a user.
3. Click the **Billing admin** field in that user's row.
4. Read the summary, then click **Change billing user**.
## Invoices
If you pay using a credit card, the **Invoices** section lets you view monthly invoices. The following exceptions apply:
* For Enterprise accounts that pay through wire transfer, this section is blank. For questions, contact your account team.
* If your organization incurs no charges, no invoice is generated.
For categories with no usage limit, **Allowance** displays as **Unlimited** and no threshold lines appear.
### View and manage usage Alerts
Usage alerts notify organization and billing admins by email when your organization reaches 85% and 100% of its usage limit for the current billing period in a given category. Configure usage alerts to monitor consumption and avoid unexpected overages. Usage alerts are available for the following categories:
| Category | Description |
| --------- | ----------------------------------------------------------------------------------------------------------------------------------------------------------------------------------------------------- |
| Storage | Total accumulated volume of your organization's stored artifacts and run data, measured in GB. |
| Weave | Total volume of data imported during the billing period, measured in MB. Shown only if Weave is active in the deployment. |
| Inference | Total input and output tokens used by Inference. See [Inference Pricing](https://wandb.ai/site/pricing/inference/). Shown only if Inference is active in the deployment. |
| Training | Token-based inference and compute, measured in GPU/hour. See [Serverless RL Pricing](https://wandb.ai/site/pricing/reinforcement-learning/). Shown only if Serverless RL is active in the deployment. |
| Sandboxes | Flat rate per billing period, determined by your plan. See [Pricing](https://wandb.ai/site/pricing/). Shown only if Sandboxes are active in the deployment. |
Usage alerts are not available for categories with no usage limit like tracked hours, or during a trial.
For organizations on the **Enterprise** plan, all **Organization admins** and **Billing admins** receive and can configure usage alerts. On the [Pro plan](https://wandb.ai/site/pricing/), only the **Billing admin** receives usage alerts.
Messages are sent from `support@wandb.com`. The thresholds are not configurable, but you can selectively turn off one or both alerts per category.
To configure usage alerts for your organization, you must be an **Organization admin** or **Billing admin**.
1. In the top right corner, click your user profile icon.
2. In the **Account** section, click **Usage & Alerts**. Alternatively, click **Settings**, then click the **Usage & Alerts** tab.
3. From the sidebar, select a category.
4. Click the **Usage** tab to view your organization's usage and alert settings for that category.
5. Turn on or off the **85% usage alert** or **100% usage alert** for that category. With no active usage alerts for a category, your organization could reach 100% of usage in a category without warning.
### View and manage spending Alerts
In a given billing period, spending alerts notify organization and billing admins by email when your organization reaches one or more customizable spending thresholds expressed in USD. Use spending alerts to track costs against a budget you define. You can configure up to five unique spending alerts per category:
| Category | Description |
| --------- | -------------------------------------------------------------------------------------------------------------------------------------------------------------------------------------------------------------------------------------------- |
| Storage | Charges for your organization's storage [usage](#usage-alerts) during the billing period. See [Pricing](https://wandb.ai/site/pricing/). |
| Weave | Charges for your organization's Weave [usage](#usage-alerts) during the billing period. See [Pricing](https://wandb.ai/site/pricing/). Shown only if Weave is active in the deployment. |
| Inference | Charges for your organization's Inference [usage](#usage-alerts) during the billing period. See [Inference Pricing](https://wandb.ai/site/pricing/inference/). Shown only if Inference is active in the deployment. |
| Training | Charges for your organization's Serverless RL [usage](#usage-alerts) during the billing period. See [Serverless RL Pricing](https://wandb.ai/site/pricing/reinforcement-learning/). Shown only if Serverless RL is active in the deployment. |
| Sandboxes | Flat rate per billing period, determined by your plan. See [Pricing](https://wandb.ai/site/pricing/). Shown only if Sandboxes are active in the deployment. |
* Spending alerts are not available for categories with no spending limit or during a trial.
* You aren't billed for tracked hours, which are unlimited for all plans.
Messages are sent from `support@wandb.com`.
On the **Enterprise** plan:
* All **Organization admins** and **Billing admins** receive spending alerts.
* No spending alerts are configured by default.
On the Pro plan:
* Only the **Billing admin** receives spending alerts.
* By default, spending alerts are configured at $200, $450, $700, and $1,000.
To view and manage your organization's spending alerts:
1. In the top right corner, click your user profile icon.
2. In the **Account** section, click **Usage & Alerts**. Alternatively, click **Settings**, then click the **Usage & Alerts** tab.
3. From the sidebar, select a category.
4. Initially, the **Usage** tab displays. To view spending alerts, click **Spend alerts**. All configured spending alerts for the category display.
5. To add an alert, click **Add alert**.
a. Enter a threshold amount in USD.
a. Click **Create alert**.
6. To delete a spending alert, click the trash icon next to it.
## Payment methods
The **Payment methods** section shows the payment methods on file for your organization. If you haven't added a payment method, you're prompted to do so when you upgrade your plan or add paid storage.
## Billing admin
The **Billing admin** section shows the current billing admin. The billing admin is an organization admin, receives all billing-related emails, and can view and manage payment methods.
In W\&B Dedicated Cloud, multiple users can be billing admins. In W\&B Multi-tenant Cloud, only one user at a time can be the billing admin.
To change the billing admin or assign the role to additional users:
1. Click **Manage roles**.
2. Search for a user.
3. Click the **Billing admin** field in that user's row.
4. Read the summary, then click **Change billing user**.
## Invoices
If you pay using a credit card, the **Invoices** section lets you view monthly invoices. The following exceptions apply:
* For Enterprise accounts that pay through wire transfer, this section is blank. For questions, contact your account team.
* If your organization incurs no charges, no invoice is generated.